What is Demand Curve?
In economics, Demand curve is a graphical presentation of the demand schedule. It is obtained by plotting a demand schedule.
The demand schedule can be converted into a demand curve by graphically plotting the different combinations of price and quantity demanded of a product.

Table of Content
Also Read: What is Demand in Economics?
Types of Demand Curve
Similar to demand schedule, there are two types of demand curve.
2 Types of Demand Curve are:
Individual demand curve
Individual demand curve: It is the curve that shows different quantities of a commodity which an individual is willing to purchase at all possible prices in a given time period with an assumption that other factors are constant.
Refer to Table 1 below, the individual demand schedules of A and B, when plotted on a graph, will represent the individual demand curves, which are shown in Figures:
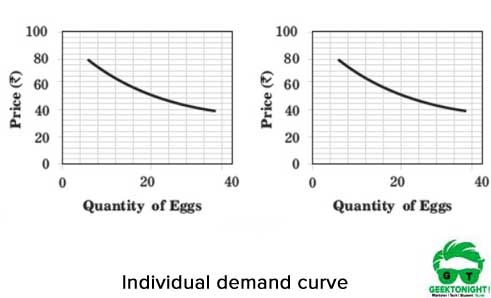
An individual demand curve slopes downwards to the right, indicating an inverse relationship between the price and quantity demanded of a commodity.
Market demand curve
Market demand curve: This curve is the graphical representation of the market demand schedule. A market demand curve shows different quantities of a commodity which all consumers in a market are willing to purchase at different price levels at a given time period, while other factors remaining constant.
A market demand curve can be plotted by consolidating individual demand curves. Therefore, market demand curve is the horizontal summation of individual demand curves.
Therefore, market demand curve is the horizontal summation of individual demand curves. In the example given in Table 1 below, plotting the price of eggs (column 1) against the summation of quantities demanded by A and B (column 4) would represent a market demand curve. This is shown in Figure below:
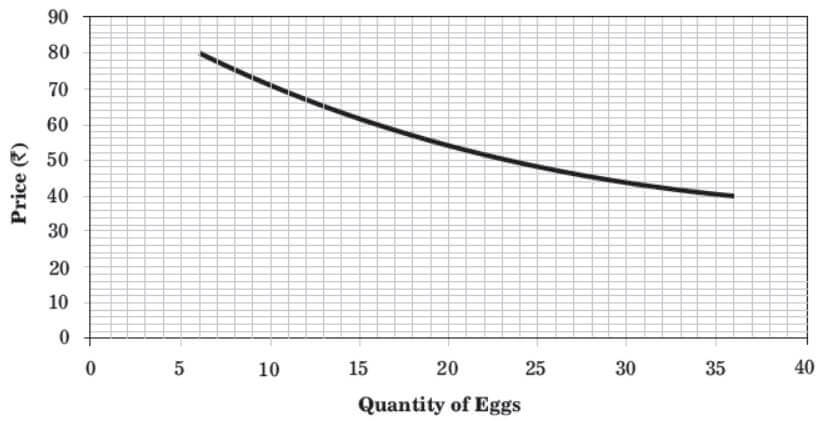
A market demand curve, just like the individual demand curves, slopes downwards to the right, indicating an inverse relationship between the price and quantity demanded of a commodity.
The negative slope of a demand curve is a reflection of the law of demand
However, it is important to understand the reasons why the demand curve slopes downward to the right.
| PRICE PER DOZEN (IN ₹ PER DOZEN) | QUANTITY DEMANDED BY A (IN DOZENS PER WEEK) | QUANTITY DEMANDED BY B (IN DOZENS PER WEEK) | TOTAL MARKET DEMAND (A + B) (IN DOZENS PER WEEK) |
|---|---|---|---|
| (1) | (2) | (3) | (4) |
| 80 | 2 | 4 | 2 + 4 = 6 |
| 70 | 4 | 6 | 4 + 6 = 10 |
| 60 | 6 | 10 | 6 + 10 = 16 |
| 50 | 9 | 15 | 9 + 15 = 24 |
| 40 | 14 | 22 | 14 + 22 = 36 |
Also Read: What is Supply Curve?
Why the demand curve slopes downward?
Generally, the demand curves slope downwards. It signifies that consumers buy more at lower prices. We shall now try to understand why the demand curve slopes downward?
Different explanations have been given different economists for the operation of the law of demand. These are explained below:
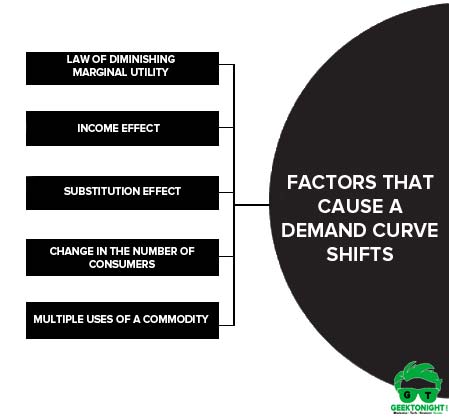
Factors that cause a demand curve shifts are:
- Law of diminishing marginal utility
- Income effect
- Substitution effect
- Change in the number of consumers
- Multiple uses of a commodity
Law of diminishing marginal utility
Consumers purchase commodities to derive utility out of them.
The law of diminishing marginal utility states that as consumption increases, the utility that a consumer derives from the additional units (marginal utility) of a commodity diminishes constantly.
Therefore, a consumer would purchase a larger amount of a commodity when it is priced low as the marginal utility of the additional units decreases.
Income effect
A change in the demand arising due to change in the real income of a consumer owing to change in the price of a commodity is called income effect.
A change in the price of a commodity affects the purchasing power of a consumer.
For example, if an individual buys two dozens of apples at 40 per kg, he/she spends 80. When the price of apples falls to 30 per kg, he/she spends 60 for purchasing two kg of apples. This results in a saving of 20 for the individual, which implies that the real income of the individual has increased by 20
The amount saved may be utilised by the individual in purchasing additional units of apples. Thus, the demand for apples increased due to a change in real income.
Substitution effect
The change in demand due to change in the relative price of a commodity is called the substitution effect.
The relative price of a commodity refers to its price in relation to the prices of other commodities.
Consumers always switch to lower-priced commodities that are substitutes of higher-priced commodities in order to maintain their standard of living. Therefore, the demand for relatively cheaper commodities increases.
For example, if the price of pizzas comes down, while the price of burgers remains the same, pizzas will become relatively (burgers) cheaper. The demand for pizzas will increase as compared to burgers.
Change in the number of consumers
When the price of a commodity decreases, the number of consumers of the commodity increases. This leads to a rise in the demand for the commodity.
For example, when the price of apples is 120 per kg, only a few people purchase it. However, when the price of apples falls down to 60 per kg, more number of people can afford it.
Multiple uses of a commodity
There are certain commodities that can serve more than one purpose. For example, milk, steel, oil, etc. However, some uses are more important over others. When the price of such a commodity is high, it will be used to serve important purposes. Thus, the demand will be low.
On the other hand, when the price of the commodity falls, it will be used for less important purposes as well. Thus, the demand will increase.
For example, when the price of electricity is high, it is used only for lighting purposes, whereas when the price of electricity goes down, it is also used for cooking, heating, etc.
Also Read: What is Demand Function?
Business Economics Tutorial
(Click on Topic to Read)
Go On, Share article with Friends
Did we miss something in Business Economics Tutorial? Come on! Tell us what you think about our article on What is Demand Curve | Business Economics in the comments section.
Business Economics Tutorial
(Click on Topic to Read)