Movement and Shift In Demand Curve
Movement along Demand Curve
Movement along Demand Curve is when the commodity experience change in both the quantity demanded and price, causing the curve to move in a specific direction.
Shift In Demand Curve
The shift in demand curve is when, the price of the commodity remains constant, but there is a change in quantity demanded due to some other factors, causing the curve to shift to a particular side.

Table of Content
Also Read: What is Demand Schedule?
Shift and Movement along Demand Curve
In economics, change in quantity demanded and change in demand are two different concepts.
Change in quantity demanded refers to change in the quantity purchased due to rise or fall in product prices while other factors are constant.
- It can be measured by the movement along the demand curve.
- The terms, change in quantity demanded refers to expansion or contraction of demand.
Change in demand refers to increase or decrease in demand for a product due to various determinants of demand other than price (in this case, price is constant).
- It is measured by shifts in the demand curve.
- The terms, change in demand means to increase or decrease in demand.
Also Read: Determinants of Demand
Expansion and Contraction of Demand
The change in the quantity demanded of a product with change in its price, while other factors are at constant, is called expansion or contraction of demand.
Expansion and contraction are represented by the movement along the same demand curve. Let us discuss the expansion and contraction of demand as follows:
Expansion or Extension of Demand
Expansion or extension of demand: It is an increase in the demand of a commodity due to decrease in its prices, while other factors are constant.
For example, in Table, when the price of apple falls from 60 per dozen to 50 per dozen, its quantity demanded rises from 6 dozens to 9 dozens by individual A. Therefore, the demand for apple is expanded or extended.
Contraction of Demand
Contraction of demand: It is a decrease in the demand of a commodity due to increase in its price, while other factors remain unchanged.
For example, when the price of apple rises from 60 per dozen to 80 per dozen, its quantity demanded falls from 6 dozens to 2 dozens by individual A. Therefore, the demand for apple is contracted.
| PRICE PER DOZEN (IN ₹ PER DOZEN) | QUANTITY DEMANDED BY A (IN DOZENS PER WEEK) | QUANTITY DEMANDED BY B (IN DOZENS PER WEEK) | TOTAL MARKET DEMAND (A + B) (IN DOZENS PER WEEK) |
|---|---|---|---|
| (1) | (2) | (3) | (4) |
| 80 | 2 | 4 | 2 + 4 = 6 |
| 70 | 4 | 6 | 4 + 6 = 10 |
| 60 | 6 | 10 | 6 + 10 = 16 |
| 50 | 9 | 15 | 9 + 15 = 24 |
| 40 | 14 | 22 | 14 + 22 = 36 |
Let us consider the graph shown in Figure
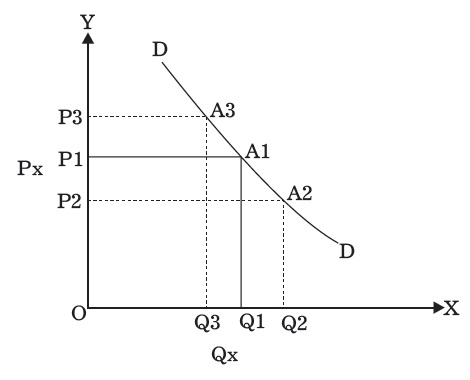
In the demand curve, when the price of commodity X is OP1, quantity demanded is OQ1. If the price of commodity X decreases to OP2, the quantity demanded increases to OQ2.
The movement of the demand curve from A1 to A2 in the downward direction is called the extension of the demand curve.
On the other hand, if the price of the commodity X rises from OP1 to OP3, the quantity demanded of commodity X falls from OQ1 to OQ3. This movement along the demand curve in the upward direction is called the contraction of demand.
Also Read: What is Demand Curve?
Increase and decrease in demand
Increase and decrease in demand takes place due to changes in other factors, such as change in income, distribution of income, change in consumer’s tastes and preferences, change in the price of related goods. In this case, the price factor remains unchanged.
Increase in demand
Increase in demand refers to the rise in demand for a product at a specific price,
Decrease in demand
Decrease in demand is the fall in demand for a product at a given price.
When other factors change, the demand curve changes its position which is referred to as a shift along the demand curve, which is shown in Figure.
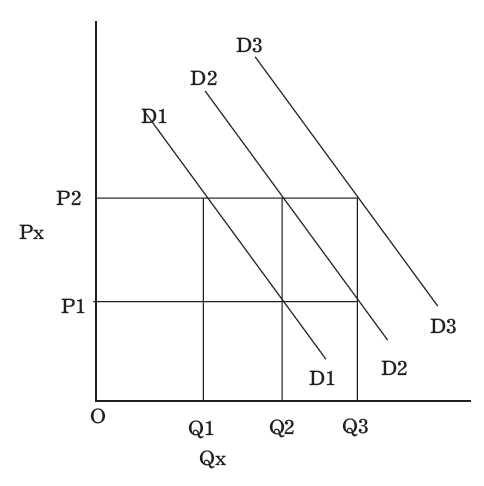
Demand curve D2 is the original demand curve of commodity X. At price OP2, the demand is OQ2 units of commodity X.
When the consumer’s income decreases owing to high income tax, he/she is able to purchase only OQ1 unit of commodity X at the same price OP2. Therefore, the demand curve, D2 shifts downwards to D1.
Similarly, when the consumer’s disposable income increases due to a reduction in taxes, he/she is able to purchase OQ3 units of commodity X at the price OP2. Therefore, the demand curve, D2 shifts upwards to D3. Such changes in the position of the demand curve from its original position are referred to as a shift in the demand curve.
Also Read: Law of Demand
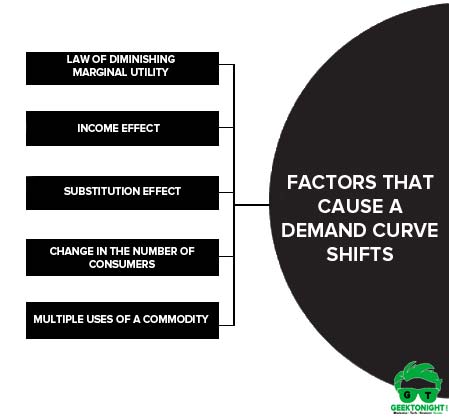
Factors that cause a demand curve shifts
Why the demand curve slopes downward? There are several factors that cause a demand curve shift. Some of them are given as follows:
Factors that cause a demand curve shifts are:
- Law of diminishing marginal utility
- Income effect
- Substitution effect
- Change in the number of consumers
- Multiple uses of a commodity
Law of diminishing marginal utility
Consumers purchase commodities to derive utility out of them.
The law of diminishing marginal utility states that as consumption increases, the utility that a consumer derives from the additional units (marginal utility) of a commodity diminishes constantly.
Therefore, a consumer would purchase a larger amount of a commodity when it is priced low as the marginal utility of the additional units decreases.
Income effect
A change in the demand arising due to change in the real income of a consumer owing to change in the price of a commodity is called income effect.
A change in the price of a commodity affects the purchasing power of a consumer.
For example, if an individual buys two dozens of apples at 40 per kg, he/she spends 80. When the price of apples falls to 30 per kg, he/she spends 60 for purchasing two kg of apples. This results in a saving of 20 for the individual, which implies that the real income of the individual has increased by 20
The amount saved may be utilised by the individual in purchasing additional units of apples. Thus, the demand for apples increased due to a change in real income.
Substitution effect
The change in demand due to change in the relative price of a commodity is called the substitution effect.
The relative price of a commodity refers to its price in relation to the prices of other commodities.
Consumers always switch to lower-priced commodities that are substitutes of higher-priced commodities in order to maintain their standard of living. Therefore, the demand for relatively cheaper commodities increases.
For example, if the price of pizzas comes down, while the price of burgers remains the same, pizzas will become relatively (burgers) cheaper. The demand for pizzas will increase as compared to burgers.
Change in the number of consumers
When the price of a commodity decreases, the number of consumers of the commodity increases. This leads to a rise in the demand for the commodity.
For example, when the price of apples is 120 per kg, only a few people purchase it. However, when the price of apples falls down to 60 per kg, more number of people can afford it.
Multiple uses of a commodity
There are certain commodities that can serve more than one purpose. For example, milk, steel, oil, etc. However, some uses are more important over others. When the price of such a commodity is high, it will be used to serve important purposes. Thus, the demand will be low.
On the other hand, when the price of the commodity falls, it will be used for less important purposes as well. Thus, the demand will increase.
For example, when the price of electricity is high, it is used only for lighting purposes, whereas when the price of electricity goes down, it is also used for cooking, heating, etc.
Also Read: What is Business Cycle
Business Economics Tutorial
(Click on Topic to Read)
Go On, Share article with Friends
Did we miss something in Business Economics Tutorial? Come on! Tell us what you think about our article on Shift In Demand Curve | Business Economics in the comments section.
Business Economics Tutorial
(Click on Topic to Read)