What is Budget Line?
Budget line represents various combinations of two commodities, which can be purchased by a consumer at the given income level and market price.
The budget line is an important element of consumer behaviour analysis. In this section, let us study about the concept and importance of the budget line in detail.
Table of Content
The indifference curve represents consumers’ preferences for a combination of two goods that are substitutes of each other.
However, actual choices made by consumers depend on their income. A budget line is the locus of all commodity combinations that a consumer can purchase by spending all his/her income.
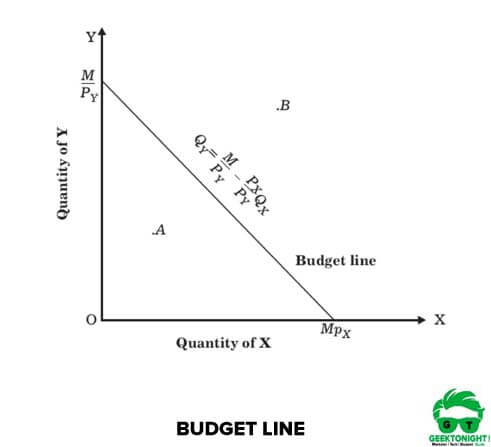
Let us assume that there are only two commodities X and Y. The price of X is Px and that of Y is Py. Let Qx be the quantity of commodity X and Qy be the quantity of commodity Y, purchased by the consumer with income M.
Then, the budget equation is represented as follows:
M = Px Qx + Py Qy
The budget equation states that the total expenditure of a consumer on various combinations of commodities X and Y cannot exceed his/ her money income M. The different quantities that the consumer can purchase using his/her income can be obtained using the following formula:
Qx = M / Px – (Py / Px . Qy) and
Qy = M / Py – (Px / Py . Qx)
When different numerical values of Qx and Qy are plotted on a graph, a straight line with a negative slope is derived. This is called the budget line or price line, which has been depicted in Figure 1::
The budget line that shows an individual’s consumption combinations, resembles a different line that separates the combinations that are attainable from those that are not, referred to as the production-possibilities frontier.
Let us understand the concept of budget line with the help of a popular example from the Second World War. During World War II, the United States concluded that it needed to produce more quantities of armaments (guns) and decided to shift butter producing factories to those producing guns. This tradeoff can be represented as a move from a point a to a point b in Figure 2.
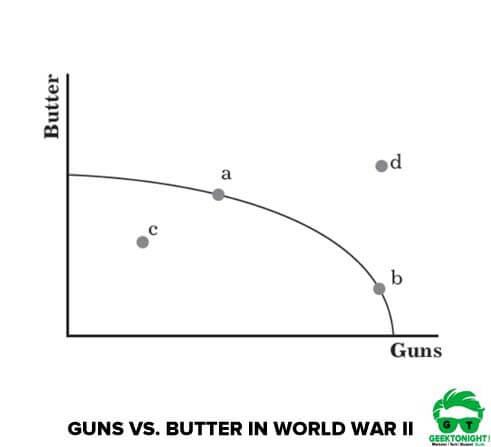
At the beginning of the War, there was a high level of unemployment owing to the recessions of 1929-33 and 1937-38, called Great Depression. Therefore, the United States was at a point c, which indicates that more of all goods could have been produced given the amount of resources and technology.
However, compared to point a or b, point d was a more desirable position although it was unattainable given the available technology and resources. During World War II, the cost of producing thousands of guns reduced the production of butter for the use of civilians.
The basic idea behind a budget line is that all economic activities take place within limitations or constraints. Owing to constraints, individuals and organisations need to prioritise certain needs and sacrifice the rest.
Also Read: Isoquant Curve: Definition, Properties, Types
Shifts in Budget Line
The budget line is derived on the basis of the income of a consumer and the prices of commodities in the market. Any change in the consumer’s income or the prices of commodities would result in a change in the budget line. This phenomenon of change is called a shift in budget line.
Let us discuss the effect of change in income M and price Px (commodity X) and Py (commodity Y) on the budget line with the help of Figure 3
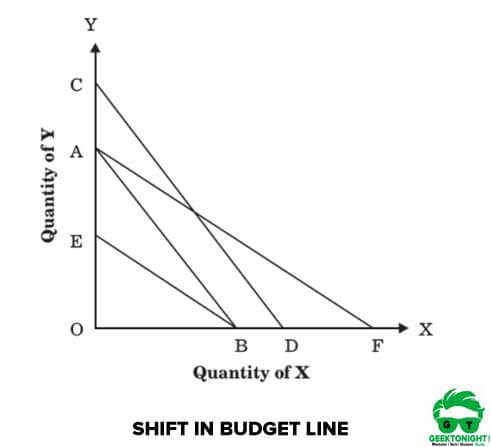
As it can be seen in Figure 3, a shift in the budget line takes place due to change in income of a consumer and the price of commodities. Let us understand this as follows:
- Change in income M: A rise in the consumer’s income results in an upward shift in the budget line with an assumption that the prices of commodities remain the same. In Figure 3, the original budget line AB shifts upwards to CD. On the other hand, a fall in the level of income results in a downward shift in the budget line, assuming that product prices remain constant. In Figure 3, the original budget line AB shifts back to its original position when M decreases.
- Change in the price of commodities: When the prices of commodities change, the budget line shifts from its original position while income remains unchanged. In Figure 3, when M and Py remain unchanged but Px decreases to half its original value, the budget line shifts from AB to AF. Similarly, when M and Px remain unchanged, and Py increases, the budget line shifts from AB to EB.
Also Read: Returns to Scale
Slope of Budget Line
The slope of budget line is an important aspect in determining consumer equilibrium. The slope of budget line indicates how many units of commodity Y a consumer would give up to buy an additional unit of commodity X or vice versa. The slope of budget line (AB) (depicted in Figure 3) is expressed as follows:
∆QY / ∆QX = OA / OB
As OA = M/Py (when X=0) and OB = M/Px (when Y=0), the slope AB can be rewritten as follows:
OA / OB = M/PY M/Px = Px / Py
Therefore, it can be inferred that the slope of the budget line is equal to the price ratio of commodities X and Y.
Also Read: Short Run Cost
Business Economics Tutorial
(Click on Topic to Read)
Go On, Share article with Friends
Did we miss something in Business Economics Tutorial? Come on! Tell us what you think about our article on Budget Line | Business Economics in the comments section.
Business Economics Tutorial
(Click on Topic to Read)