What is Demand Schedule?
Demand schedule is a tabular representation of different quantities of commodities that consumers are willing to purchase at a specific price and time while other factors are constant.

Table of Content
Demand Schedule Definition
A full account of the demand, or perhaps we can say, the state of demand for any goods in a given market at a given time should state what the volume (weekly) of sales would be at each of a series of prices. Such an account, taking the form of a tabular statement, is known as a demand schedule.
Benham
Also Read: What is Business Economics?
Types of Demand Schedule
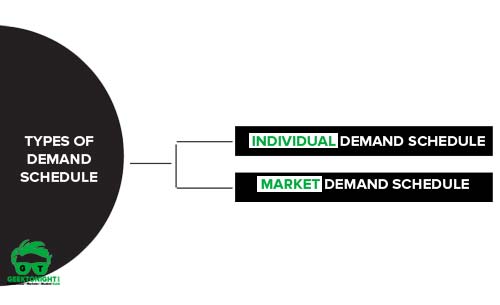
Two types of demand schedule are:

Individual demand schedule
Individual demand schedule: It is a tabular representation of quantities of a commodity demanded by an individual at a particular price and time, provided all other factors remain constant.
Market demand schedule
Market demand schedule: There is more than one consumer of a commodity in the market. Each consumer has his/her own individual demand schedule. If the quantities of all individual demand schedules are consolidated, it is called market demand schedule.
Also Read: What is Demand Function?
Demand Schedule Example
Let us understand the concept demand schedule with the help of a demand schedule example:
Assume that there are two individuals A and B in the market. They have a particular individual demand for Apple. The individual demand schedules for A and B and the consequent market demand are shown in Table
| PRICE PER DOZEN (IN ₹ PER DOZEN) | QUANTITY DEMANDED BY A (IN DOZENS PER WEEK) | QUANTITY DEMANDED BY B (IN DOZENS PER WEEK) | TOTAL MARKET DEMAND (A + B) (IN DOZENS PER WEEK) |
|---|---|---|---|
| (1) | (2) | (3) | (4) |
| 80 | 2 | 4 | 2 + 4 = 6 |
| 70 | 4 | 6 | 4 + 6 = 10 |
| 60 | 6 | 10 | 6 + 10 = 16 |
| 50 | 9 | 15 | 9 + 15 = 24 |
| 40 | 14 | 22 | 14 + 22 = 36 |
In Table, the individual demand schedule of A and B are depicted in the columns (2) and (3) at different price levels shown in column (1). Column (4) depicts the market demand schedule, which is the sum total of the individual demands of A and B. As shown in Table, at a price level of ₹80 per dozen of apple, individual demand by A and B are 2 dozens per week and 4 dozens per week respectively.
The market demand (assuming there are only two individuals in the market) is the sum total of individual demands i.e. 6 dozens a week.
The law of demand can also be represented graphically with the help of a Demand Curve.
Also Read: What is Supply Schedule?
Business Economics Tutorial
(Click on Topic to Read)
Go On, Share article with Friends
Did we miss something in Business Economics Tutorial? Come on! Tell us what you think about our article on What is Demand Schedule? | Business Economics in the comments section.
Business Economics Tutorial
(Click on Topic to Read)


