What is Market Equilibrium?
Market Equilibrium is a situation where the price at which quantities demanded and supplied are equal (Supply = Demand). When the market is in equilibrium, there is no tendency for prices to change.
Table of Content
Market system is driven by two forces, which are demand and supply. This is because these two forces play a crucial role in determining the price at which a product is sold in the market. Price is determined by the interaction of demand and supply in a market.
According to the economic theory, the price of a product in a market is determined at a point where the forces of supply and demand meet. The point where the forces of demand and supply meet is called equilibrium point.
Conceptually, equilibrium means state of rest. It is a stage where the balance between two opposite functions, demand and supply, is achieved.
Mathematically, market equilibrium is expressed as:
Qd (P) = Qs (P)
Where,
Qd (P) is the quantity demanded at price P
Qs (P) is the quantity supplied at price P
Let us understand the concept of market equilibrium with the help of an example. Table 1 shows the demand and supply of fans in Delhi at different price levels.
| Price (₹ per fan) | Supply (‘000 in a month) | Demand (‘000 in a month) |
|---|---|---|
| 600 | 55 | 80 |
| 650 | 65 | 75 |
| 700 | 70 | 70 |
| 750 | 75 | 50 |
In Table 1, it can be observed that at the price of ₹700, the demand and supply of fans is equal i.e. 70,000 fans. Therefore, market equilibrium exists at 70,000 where demand and supply are the same. Figure 1 shows the market equilibrium of demand and supply of fans mentioned in Table 1:
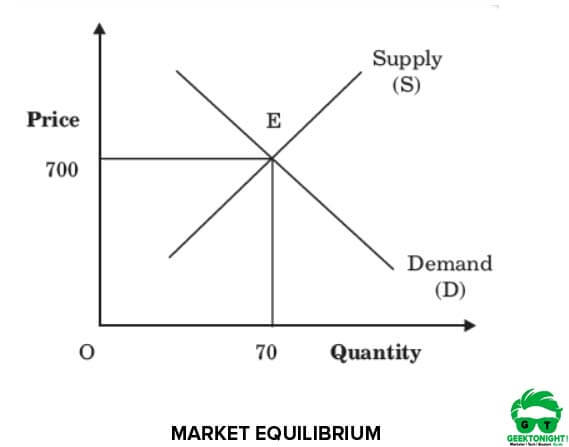
In Figure 1, E is the point where demand and supply both intersect. Thus, market equilibrium exists at point E where demand and supply are equal.
Also Read: Supply Curve Shifts
Determination of Market Price
As mentioned earlier, the market equilibrium price of a product is determined at the point of intersection of demand and supply. However, it is important to understand how the price is determined. Let us understand the determination market price with the help of an example.
Let us consider the example of fans (as given in Table 1). In Table 1, it is mentioned that when price is ₹600, the demand for fans is 80,000 units while supply is 55,000 units. This indicates that there is a shortage of 25,000 fans in the market. As a result of this shortage, the seller tries to increase their earnings by raising the price of fans.
On the other hand, consumers would be willing to purchase at the price quoted by the seller due to the shortage of fans. This leads to an increase in the profit of the seller, which, in turn, would improve the production of fans. As a result, the supply of fans increases. The process of increase in prices goes on till the price of fans reaches to ₹700.
As shown in Table 1, at the price of 700, the demand is reduced to 70, 000 fans, while the supply is also increased to 70,000 fans. Thus, equilibrium is reached. This will lure consumers to buy more due to reduction in the price of fans. As a result of an increase in buying, the equilibrium price would be ₹300.
Also Read: Determinants of Demand
Shifts in Market Equilibrium
A shift in supply or demand curve also shifts the equilibrium point. Let us understand the mechanism of shift in market equilibrium in the case of shift of supply and demand curves respectively.
Shift in Demand Curve
Figure 2 shows a shift in the demand curve:
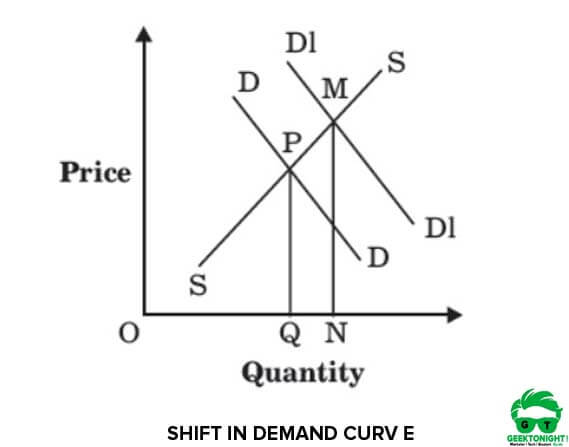
In Figure 2, the initial equilibrium price is observed at PQ and quantity at OQ. When the demand curve is shifted from initial demand curve DD to D1D1, there is a shift in the equilibrium from PQ to MN.
Thus, the new equilibrium price is at MN and the quantity is at ON. However, supply remains the same in this case. Thus, it can be said that when the demand curve shifts, an increase in quantity leads to an increase in the equilibrium price.
Shift in Supply Curve
Figure 3 shows a shift in the supply curve:
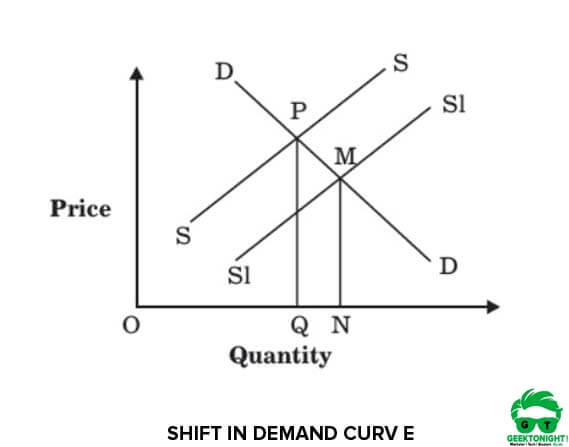
(when shift in supply is more than demand)
In Figure 3, the initial equilibrium price is placed at PQ and quantity at OQ. As the supply curve shifts from SS to S1S1, the equilibrium point also shifts from PQ to MN. After the shift, the new equilibrium price is at MN and the quantity is at ON. However, demand remains the same in this case.
Thus, it can be said that when supply curve shifts, an increase in quantity results in an increase in the equilibrium price too.
Also Read: Price Elasticity of Demand
Complex Cases of Shift in Equilibrium
Now, let us understand what impact simultaneous shifts in the demand and supply curve have on the equilibrium point. The extent of shift in the demand and supply curves determines the impact on the equilibrium point.
If the shift in supply curve is greater than the demand curve, equilibrium price falls and output rises. Figure 4 shows the impact on equilibrium point when shift in supply curve is more than the shift in demand.
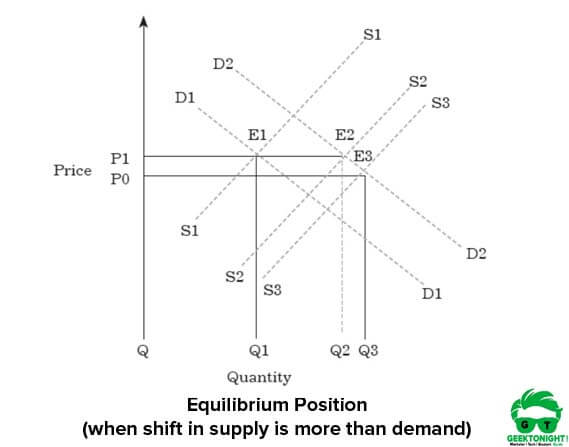
In Figure 4, the initial equilibrium position, E1 is the point where demand curve D1D1 and supply curve S1S1 intersect. At this point, equilibrium price and quantity is P1 and OQ1 respectively. As the demand curve shifts from D1D1 to D2D2 and supply curve shifts from S1S1 to S3S3, there is a shift in equilibrium from E1 to E3.
Here, the shift in supply is greater than the demand shift; therefore, equilibrium price falls down to P0 and output rises to OQ3.
However, if the shift in demand and supply curve is equal that is D2D2 and S2S2 respectively, there is no change in equilibrium price while output increases to Q2.
In case, shift in demand curve is greater than the shift in supply curve, both equilibrium price and quantity, increase, as shown in Figure 5:
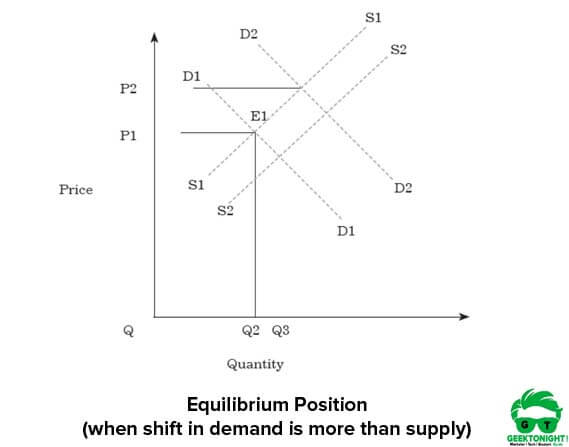
(when shift in demand is more than supply)
In Figure 5, E1 is the initially equilibrium which is obtained by balancing the demand curve, D1D1 and supply curve, S1S1. At E1, equilibrium price is P1 and quantity is OQ1.
Now, when the demand curve shifts from D1D1 to D2D2 and supply curve shifts from S1S1 to S2S2, equilibrium also shifts from E1 to E2. As can be seen the Figure 5, demand shift is greater than the shift in supply; therefore, equilibrium price is increased to P2 and output is increased to OQ2.
Also Read: Elasticity of Demand
Business Economics Tutorial
(Click on Topic to Read)
Go On, Share article with Friends
Did we miss something in Business Economics Tutorial? Come on! Tell us what you think about our article on Market Equilibrium | Business Economics in the comments section.
Business Economics Tutorial
(Click on Topic to Read)