
What is Hypothesis Testing?
Hypothesis testing is a process to make decisions for research problems by using sample data. It is a logical method of taking and validating decisions.
In hypothesis testing, you take two statements:
- The first statement states that there is no relationship or no difference between two variables under study. You take this statement (also known as null hypothesis) as true. A null hypothesis statement involves equality (≤, ≥, or =) about a population parameter.
- The second statement states that there is a relationship or difference between two variables under study. You take this statement (also known as alternative hypothesis) as false. Alternative hypothesis contradicts null hypothesis and must not involve equality (<, ≠, >).
Table of Content
After that, you test the null hypothesis to accept or reject it. The null hypothesis is tested with the help of the levels of significance. A significance level is the probability of rejecting null hypothesis in a statistical test when it is true. It is expressed in percentage and its value can be calculated from the tables of various test statistics. Examples of test statistic are t-test, z-test, and F-test. You would learn about these tests in detail in the upcoming chapters.
After the null and alternative hypothesis have been stated, the researcher sets the decision criteria for which he/she needs to state the level of significance of test. The most commonly used levels of significance in statistics are 1%, 5% and 10%. For example, if 5% is the most commonly used level of significance in behavioural studies, then it implies that the 5% area of the normal curve would be used for testing the hypothesis and the value for this area is taken from the table of the respective test statistic.
For instance, the z-values for the various levels of significance are shown in Figure:
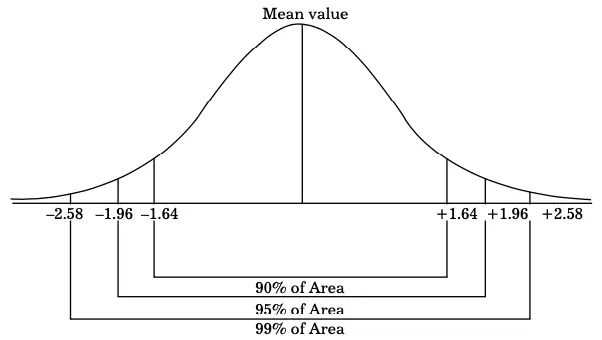
z-Values for the Levels of Significance
In Figure, you can see that the areas expressed in percentage and their values are given on X-axis. Table provides the levels of significance and their z-values:
| Level of Significance | z-value |
|---|---|
| 1 % | +/– 2.58 (for two-tailed) |
| 1 % | +/– 2.33 (for one-tailed) |
| 5% | +/– 1.96 (for two-tailed) |
| 5% | +/– 1.64 (for one-tailed) |
| 10% | +/– 1.64 (for two-tailed) |
| 10% | +/– 1.28 (for one-tailed) |
In hypothesis testing, the value level of significance is very important, as it helps you in rejecting or accepting a null hypothesis. You should be careful while formulating or determining the level of significance for a problem/topic. The reason is that you may reject a true hypothesis on the basis of a level of significance. If the level of significance is 5%, it implies that the probability of rejecting a true hypothesis is 0.05 (max).
After the level of significance has been set, the researcher then proceeds to compute the test statistic which basically describes how far a sample mean is from the population mean. The greater the value of test statistic, the farther is the sample mean from the population mean described in null hypothesis.
Thereafter, on the basis of value of test statistic, a decision is made. If the null hypothesis is true and the probability of obtaining a sample mean is less than 5%, then we reject the null hypothesis. On the contrary, if null hypothesis is true and the probability of obtaining a sample mean is more than 5%, then the null hypothesis is retained.
Null Hypothesis and Alternative Hypothesis
Null hypothesis represents the first statement of a hypothesis that is assumed to be true. This statement indicates that there is no relationship between two variables under study and if there exists, any relation that is purely due to chance. Alternative hypothesis represents the second statement of a hypothesis that is assumed to be false. This statement indicates that there is a relationship between the two variables.
Let us understand these through the following example:
Example 1: Assume that a researcher if a patient takes physiotherapy sessions two times instead of three times in a week post operation, then, his/her recovery time would be greater.
Assume that the average recovery time after operation is 7 weeks:
H0 : The average recovery time after operation is less than or equal to 7 weeks.
H1 : The average recovery time after operation is greater than 7 weeks.
From the preceding two examples, it is clear that H0 is totally opposite of the statement the researcher wants to study. The researchers always test H0 for significance, not H1 because they are usually interested in disproving H0 . H0 and H1 are in the descriptive form. The researcher must convert them into the quantitative form to compute them.
In Example 1, the quantitative forms of H0 and H1 are as follows:
H0 : μ ≤ 7
H1 : μ > 7
Where,
µ = Population mean
You can also formulate a hypothesis for testing with the help of a benchmark. This benchmark is a numerical digit with which you have to compare your results and test the hypothesis. This is one of the finest and widely used methods for framing null and alternate hypotheses because it represents null and alternate hypotheses in quantitative form.
This makes hypothesis testing easier. For example, in a school, the average weight of every class is 100 (population mean). You consider all sections of class 10 as a sample (assume there are 5 sections of class 10) and calculate their average weight (sample mean). Now, you want to check whether the sample mean is equal to the population mean or not.
In this case, H0 and H1 would be as follows:
H0 : X = 100
H1 : X < 100
Where,
X = Sample mean
μp = Population mean = 100
The researchers assume that the null hypothesis is true and proceed further to find out various methods/possibilities to solve the problem. They try to reject the null hypothesis. A hypothesis can never be right or wrong. Rather, it is judged by what you want to analyse. If a hypothesis is framed in such a way that it can answer your problem, then it would be right.
Decision Rule
Decision rule refers to the process or criteria that a researcher uses to decide whether to accept or reject the null hypothesis. For example, a researcher forms a hypothesis that the mean age of a population is equal to 30. The researcher then collects a sample of observations to test this hypothesis. He/she will then create a decision criterion.
For instance, the researcher may decide to accept the hypothesis if the sample mean was in the range of 10% on either side of 30, i.e., 30 ± 10% = between 27 and 33.
It means that the researcher would reject the hypothesis if mean of sample was below 27 or above 33. It is important to note that different types of errors may occur while testing a hypothesis. Therefore, the researcher should take into consideration the possibilities of these errors, while taking decisions.
The decision grid helps the researcher in taking decisions, which is shown in Figure:
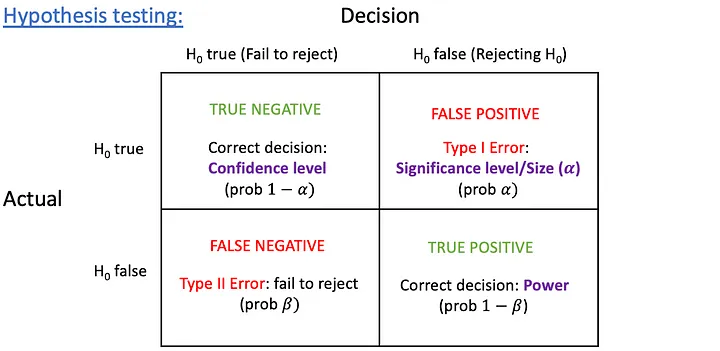
As per the grid shown in Figure, if H0 is true and it is accepted, then the decision is correct. If H0 is false and it is rejected, then also the decision is right. However, if the decision is wrong, two types of errors can occur, which are explained as follows:
- Type I errors: These errors occur when the researcher rejects a null hypothesis (H0 ) when null hypothesis was true. In this case, the decision taken by the researcher is wrong. Type I errors are also known as the first kind of error or false positive. These errors are represented by a.
- Type II errors: Type II errors occur when the researcher accepts a null hypothesis (H0 ) that should have been rejected. In this case, the decision taken by the researcher is wrong. Type II errors are also known as the second kind of error or false negative. These errors are represented by b.
The probability of rejecting the null hypothesis when it is false = 1 – b and is called as the power of test. If you minimise Type I errors, Type II errors would increase or vice-versa. Therefore, you have to be very careful while minimising one type of error. You must remember that both the types of errors can be limited using an appropriate sample size.
Two-Tailed Test
Two-tailed test is a part of non-directional hypothesis that talks about the relationship between two variables but does not explain anything about the direction of the relationship. For example, a company produces tennis balls and it has laid down that the ball should weigh 55 grams in order to get good ratings.
The samples are drawn on hourly basis and checked for ideal weight. In a given hour, 11 balls are checked randomly and their mean is calculated as 55.006 grams and SD of 0.029 grams. If the production line gets out of sync with more than 1% level of significance, the production line is shut down.
Let us see if the production line should be shut down in this case.
Here,
μp = 55 g;
H0 : μp = 55 g
H1 : μp ≠ 55 g
α = 1% =0.01
Therefore, α/2 = 0.005
p = 1 – (α/2) = 0.995
Degree of freedom of sample = n – 1 = 11 – 1 = 10
Here, tp = 3.169
Now, calculate tc .
The two-tailed test can be shown on a normal curve in Figure:
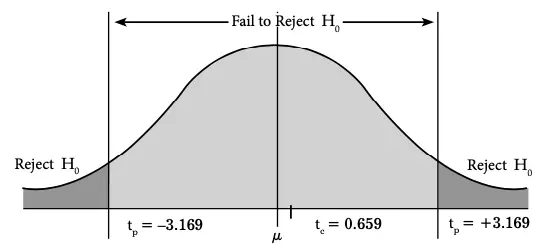
In Figure 9.4, at the 1% level of significance, the t value would be ±3.169. If the calculated value of test statistics lies in between the range of –3.169 and +3.169, then H0 would be accepted. However, if the calculated value of test statistics lies outside this range, it would be rejected. Here, the rejection region is equally divided between two tails of the distribution (–0.005 is upper tail and 0.005 is lower tail). In this example, the null hypothesis is accepted.
One-Tailed Test
One-tailed test is a part of directional hypothesis that talks not only about the relationship between two variables but also the direction of relationship. It is considered when you want to test a hypothesis on either positive or negative side of a normal curve. When the hypothesis testing involves rejection region only on one side of the sampling distribution, it is called as a one-tailed hypothesis test.
For example, assume that the null hypothesis states that mean weight of people is 60 kg or more. In this case, the alternative hypothesis would be that the mean weight of people is less than 60 kg. Here, the rejection region comprises of the range of numbers 0 to 60 located on the left side of sampling distribution (set of numbers that are less than 60).
The onetailed test also forms a normal curve as shown in Figure:
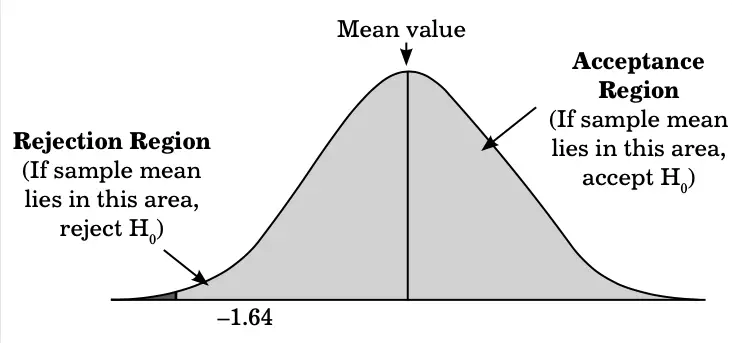
One-tailed Test
In Figure 9.5, at the 5% level of significance, z value would be –1.64. If the sample mean is greater than –1.64, then H0 is accepted. Else, H0 is rejected. The level of significance can be represented with the help of α and α/2 in one-tailed test and two-tailed test, respectively.
For example:
- In one-tailed test, if the level of significance is 5%, then α is 5%. In this case, the value of test statistics would be determined at 0.05.
- In two-tailed test, if the level of significance is 5%, then the value of test statistics would be determined at 0.025% (α/2).
Procedure of Hypothesis Testing
Hypothesis testing is a step-by-step process that starts with the formulation of hypothesis and ends with decision making. The steps involved in hypothesis testing are:
- State H0 and H1
- State the Level of Significance
- Decide on the Type of the Test of Significance
- State the Decision Rule
- Calculate the Test Statistics
- Take a Decision
State H0 and H1
In this step, null hypothesis and the alternative hypothesis are framed. For example, a research organisation wants to perform a significance test to determine whether, the mean weight of Indian children aged 5 is 20 kg or not (as claimed by reports). In this case, H0 and H1 would be as follows:
μp = 20
H0 : μp = 20 kg
H1 : μp ≠ 20 kg
Where, μp= Population mean
State the Level of Significance
This refers to deciding the level of significance (a) for the hypothesis test. The most commonly used level of significance is 5%. This happens because the range 5% is neither too big nor too small to accept or reject a hypothesis.
Decide on the Type of the Test of Significance
The test of significance is used to check the hypothesis at a given level of significance. There are various types of tests of significance, such as t-test, z-test, and F-test. The selection of a test depends on various factors such as the sample size, variance and type of population. For example, you use the t-test when the sample size is less than 30 and the z-test when the sample size is more than 30.
State the Decision Rule
It refers to determining the conditions under which the null hypothesis is accepted or rejected. If the decision rule is not determined correctly, then there are chances of committing Type I and Type II errors. Therefore, you should be careful while making the decision rule.
Calculate the Test Statistics
It refers to ascertaining the value of test statistics to accept or reject the hypothesis.
Take a Decision
It refers to either accepting or rejecting H0 on the basis of the calculated value of test statistics. If the calculated probability is equal to or smaller than a value (in one tailed test) or smaller than a/2 (in two-tailed test), then null hypothesis is rejected. However, if calculated probability is greater than a value, then null hypothesis is accepted. Rejecting H0 may lead to Type I error whereas accepting H0 may lead to Type II error.
Business Ethics
(Click on Topic to Read)
- What is Ethics?
- What is Business Ethics?
- Values, Norms, Beliefs and Standards in Business Ethics
- Indian Ethos in Management
- Ethical Issues in Marketing
- Ethical Issues in HRM
- Ethical Issues in IT
- Ethical Issues in Production and Operations Management
- Ethical Issues in Finance and Accounting
- What is Corporate Governance?
- What is Ownership Concentration?
- What is Ownership Composition?
- Types of Companies in India
- Internal Corporate Governance
- External Corporate Governance
- Corporate Governance in India
- What is Enterprise Risk Management (ERM)?
- What is Assessment of Risk?
- What is Risk Register?
- Risk Management Committee
Corporate social responsibility (CSR)
Lean Six Sigma
- Project Decomposition in Six Sigma
- Critical to Quality (CTQ) Six Sigma
- Process Mapping Six Sigma
- Flowchart and SIPOC
- Gage Repeatability and Reproducibility
- Statistical Diagram
- Lean Techniques for Optimisation Flow
- Failure Modes and Effects Analysis (FMEA)
- What is Process Audits?
- Six Sigma Implementation at Ford
- IBM Uses Six Sigma to Drive Behaviour Change
Research Methodology
Management
Operations Research
Operation Management
- What is Strategy?
- What is Operations Strategy?
- Operations Competitive Dimensions
- Operations Strategy Formulation Process
- What is Strategic Fit?
- Strategic Design Process
- Focused Operations Strategy
- Corporate Level Strategy
- Expansion Strategies
- Stability Strategies
- Retrenchment Strategies
- Competitive Advantage
- Strategic Choice and Strategic Alternatives
- What is Production Process?
- What is Process Technology?
- What is Process Improvement?
- Strategic Capacity Management
- Production and Logistics Strategy
- Taxonomy of Supply Chain Strategies
- Factors Considered in Supply Chain Planning
- Operational and Strategic Issues in Global Logistics
- Logistics Outsourcing Strategy
- What is Supply Chain Mapping?
- Supply Chain Process Restructuring
- Points of Differentiation
- Re-engineering Improvement in SCM
- What is Supply Chain Drivers?
- Supply Chain Operations Reference (SCOR) Model
- Customer Service and Cost Trade Off
- Internal and External Performance Measures
- Linking Supply Chain and Business Performance
- Netflix’s Niche Focused Strategy
- Disney and Pixar Merger
- Process Planning at Mcdonald’s
Service Operations Management
Procurement Management
- What is Procurement Management?
- Procurement Negotiation
- Types of Requisition
- RFX in Procurement
- What is Purchasing Cycle?
- Vendor Managed Inventory
- Internal Conflict During Purchasing Operation
- Spend Analysis in Procurement
- Sourcing in Procurement
- Supplier Evaluation and Selection in Procurement
- Blacklisting of Suppliers in Procurement
- Total Cost of Ownership in Procurement
- Incoterms in Procurement
- Documents Used in International Procurement
- Transportation and Logistics Strategy
- What is Capital Equipment?
- Procurement Process of Capital Equipment
- Acquisition of Technology in Procurement
- What is E-Procurement?
- E-marketplace and Online Catalogues
- Fixed Price and Cost Reimbursement Contracts
- Contract Cancellation in Procurement
- Ethics in Procurement
- Legal Aspects of Procurement
- Global Sourcing in Procurement
- Intermediaries and Countertrade in Procurement
Strategic Management
- What is Strategic Management?
- What is Value Chain Analysis?
- Mission Statement
- Business Level Strategy
- What is SWOT Analysis?
- What is Competitive Advantage?
- What is Vision?
- What is Ansoff Matrix?
- Prahalad and Gary Hammel
- Strategic Management In Global Environment
- Competitor Analysis Framework
- Competitive Rivalry Analysis
- Competitive Dynamics
- What is Competitive Rivalry?
- Five Competitive Forces That Shape Strategy
- What is PESTLE Analysis?
- Fragmentation and Consolidation Of Industries
- What is Technology Life Cycle?
- What is Diversification Strategy?
- What is Corporate Restructuring Strategy?
- Resources and Capabilities of Organization
- Role of Leaders In Functional-Level Strategic Management
- Functional Structure In Functional Level Strategy Formulation
- Information And Control System
- What is Strategy Gap Analysis?
- Issues In Strategy Implementation
- Matrix Organizational Structure
- What is Strategic Management Process?
Supply Chain

