
Hypothesis Testing
Once you have generated a hypothesis, the process of hypothesis testing becomes important. More accurately, you should have two hypotheses, the alternative and the null.
For testing, you will be analyzing and comparing your results against the null hypothesis, so your research must be designed with this in mind. It is vitally important that the research you design produces results that will be analyzable using statistical tests.
Table of Content
Most people are very afraid of statistics, due to obscure mathematical symbols, and worry about not understanding the processes or messing up the experiments. There really is no need to fear.
Most scientists understand only the basic principles of statistics, and once you have these, modern computing technology gives a whole battery of software for hypothesis testing.
Designing your research only needs a basic understanding of the best practices for selecting samples, isolating testable variables and randomizing groups.
Hypothesis Testing Example
A common statistical method is to compare a population to the mean.
For example, you might have come up with a measurable hypothesis that children have a higher IQ if they eat oily fish for a period of time.
Your alternative hypothesis, H1 would be
“Children who eat oily fish for six months will show a higher IQ increase than children who have not.”
Therefore, your null hypothesis, H0 would be
“Children who eat oily fish for six months do not show a higher IQ increase than children who do not.”
In other words, with the experiment design, you will be measuring whether the IQ increase of children fed oily fish will deviate from the mean, assumed to be the normal condition.
H0 = No increase. The children will show no increase in mean intelligence.
From IQ testing of the control group, you find that the control group has a mean IQ of 100 before the experiment and 100 afterwards, or no increase. This is the mean against which the sample group will be tested.
The children fed fish show an increase from 100 to 106. This appears to be an increase, but here is where the statistics enters the hypothesis testing process. You need to test whether the increase is significant, or if experimental error and standard deviation could account for the difference.
Using an appropriate test, the researcher compares the two means, taking into account the increase, the number of data samples and the relative randomization of the groups. A result showing that the researcher can have confidence in the results allows rejection of the null hypothesis.
Remember, not rejecting the null is not the same as accepting it. It is only that this particular experiment showed that oily fish had no affect upon IQ. This principle lies at the very heart of hypothesis testing.
Significance
The exact type of statistical test used depends upon many things, including the field, the type of data and sample size, among other things.
The vast majority of scientific research is ultimately tested by statistical methods, all giving a degree of confidence in the results.
For most disciplines, the researcher looks for a significance level of 0.05, signifying that there is only a 5% probability that the observed results and trends occurred by chance.
For some scientific disciplines, the required level is 0.01, only a 1% probability that the observed patterns occurred due to chance or error. Whatever the level, the significance level determines whether the null or alternative is rejected, a crucial part of hypothesis testing.
Empirical Evidence
“Empirical evidence” or “scientific evidence” is the evidence which serves the purpose of either supporting or counter a scientific hypothesis or theory.
The word “empirical” indicates information gained by means of observation, experience, or experiments.
A central theme of science and scientific method is that all evidence must be empirical, or at least empirically based, that is, it should depend on evidence or results that can be observed by our senses. It should be noted here that scientific statements are subject to and derived from our experience or observations and empirical data is based on both observations and experiment results.
In the process of accepting or disproving any hypothesis, facts (evidence) are coupled with inference which is the act of deriving a conclusion on the basis of observations or experiment.
However, scientific evidence or empirical evidence is the evidence where evidence does depend on inference thus it enables other researchers to examine the assumptions or hypothesis employed to see if facts are relevant at all to the support of or counter the hypothesis.
For example, an infective organism, “Helicobacter pylori”, has shown to cause stomach ulcers in humans. Following evidence may prove the hypothesis that H. pylorus is indeed a cause of peptic ulcers in humans.
- If someone voluntarily ingests H. pylori, it results in chronic gastritis
- Experimental challenge to animals stimulates human infection and gastritis
- Proper antimicrobial therapy in patients clears infection and thus clears gastritis
- The H. pylori only found in gastric epithelium
- There is a systemic immune response seen in patients with H. pylori infection
- Antibodies against H. pylori disappears after successful antimicrobial therapy
Let’s take another example of global warming which remains an ongoing dispute about the effects of humans on global climate. You may hear following evidence in favour or theory of global warming:
- Graphs of historical trends show increasingly warming temperature
- The levels of carbon dioxide gas are on the rise in atmosphere
- The levels of methane are also rising
- We have seen more frequent extreme weather as never before
- Glaciers are disappearing rapidly
- Arctic seas’ ice is melting
- Antarctic seas’ ice is also melting
- Greenland’s ice sheet is also melting
- Incidence of tropical diseases is on the rise
- Oceans are warming with Coral bleaching and disintegration
No hypothesis or theory can be called scientific or accepted if it lacks empirical evidence in favour. Therefore, empirical evidence can be used both to accept or to counter any scientific hypothesis or theory.
Steps in Hypothesis Testing
As we have seen earlier in this Unit, hypothesis testing is all about populations and using a sample based on which we make inferences about the population. We have seen so far how to formulate hypothesis, what is the place of hypothesis testing in research, and some important concepts such as sampling distributions, confidence intervals, critical regions and significance levels. In this topic, we will refer to the steps of hypothesis testing.
The first step is to formulate the alternative and null hypotheses.
The second step is to test the null hypothesis (rather than seeking to support the experimental hypothesis), by carrying out a statistical test of significance to determine whether it can be rejected, and consequently, whether there is a difference between the groups under investigation.
For our example research question (effect of teaching method on final exams marks), the researcher would run statistical tests to test whether the difference between the means of the two samples of students (those who used method A and those who used method B) is zero.
Remember that, while testing the hypothesis of a relationship between two variables we calculate a probability: the probability of obtaining such a relationship as a result of sampling error alone (conditional probability). It is the probability of obtaining a relationship in our sample by sampling error alone, if there was no such relationship in the population. If this probability is small enough, it makes more sense to conclude that the relationship observed in our sample also exists in the population.
In the third step, the sample statistics appropriate for the sample, variables and hypotheses are calculated (in our hypotheses, the mean exam score).
In the fourth step, a significance test is conducted, to see if the null hypothesis can be rejected.
To do this, we first start with the assumption that the null hypothesis is true, and proceed to determine the probability of obtaining the sample results. In order to understand hypothesis testing, this is a quite important step to understand.
If the null hypothesis is true, what is the probability of obtaining the sample results?
Hypothesis testing involves the calculation of the probability of observing the data collected. If this probability (also know as p-value) is small, it would be very unlikely that the observed sequence would have occurred if the null hypothesis was true.
The hypothesis is retained if a test of significance would show that if the research were repeated many times, similar results would occur in at least 95 out of 100 repetitions, or in other words if the p-value (probability of obtaining the results) is less than 5% (we would then write: p< 0.05).
This specific criterion of significance level is a convention. (Sometimes two other probability levels are reported, that is, p< 0.01 (odds of 99 to 1) and p< 0.001 (odds of 999 to 1, as will be mentioned later in this topic).
Therefore, in the final step, the decision is made to reject or accept the null hypothesis:
If the probability is small, i.e., less than 0.05, the null hypothesis is rejected and the experimental hypothesis is retained, since we can say with some certainty (95% certainty) that the differences discovered between the groups in our example are not due to sampling error, but other factors.
Looking at the odds we realise that it is much more likely that the null hypothesis will be retained (95 to 1 for the 0.05 level of significance). To reject the null hypothesis we require at least a probability of 95 confirmations that there are differences in the groups for every 100 repetitions of the study.
If the probability is large, the null hypothesis cannot be rejected.
Type I and Type II Errors
It may become obvious from what has been discussed so far, that, as the procedure of significance testing is based on probabilities, it is not without errors.
We may sometimes incorrectly reject the null hypothesis (rejects it when it is true). This is called Type I error (α).
Other times, we may fail to reject the null hypothesis, and actually reject the alternative hypothesis (when it is true), which is called Type II error (β).
Type I
Error In a hypothesis test, a type I error occurs when the null hypothesis is rejected when it is in fact true; that is, H0 is wrongly rejected.
For example, in a clinical trial of a new drug, the null hypothesis might be that the new drug is no better, on average, than the current drug; i.e.
H0: there is no difference between the two drugs on average. A type I error would occur if we concluded that the two drugs produced different effects when in fact there was no difference between them.
The following table gives a summary of the possible results of any hypothesis test:
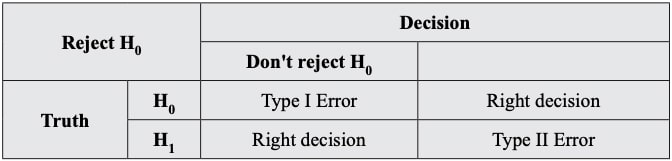
Type I and Type II Errors
A type I error is often considered to be more serious, and therefore more important to avoid, than a type II error. The hypothesis test procedure is therefore adjusted so that there is a guaranteed ‘low’ probability of rejecting the null hypothesis wrongly; this probability is never 0. This probability of a type I error can be precisely computed as
P(type I error) = significance level = α
If we do not reject the null hypothesis, it may still be false (a type II error) as the sample may not be big enough to identify the falseness of the null hypothesis (especially if the truth is very close to hypothesis).
For any given set of data, type I and type II errors are inversely related; the smaller the risk of one, the higher the risk of the other.
A type I error can also be referred to as an error of the first kind.
Type II Error
In a hypothesis test, a type II error occurs when the null hypothesis H0, is not rejected when it is in fact false. For example, in a clinical trial of a new drug, the null hypothesis might be that the new drug is no better, on average, than the current drug; i.e.
H0: There is no difference between the two drugs on average.
A type II error would occur if it was concluded that the two drugs produced the same effect, i.e., there is no difference between the two drugs on average, when in fact they produced different ones.
A type II error is frequently due to sample sizes being too small.
The probability of a type II error is generally unknown, but is symbolised by b and written.
P(type II error) = β
A type II error can also be referred to as an error of the second kind
Business Ethics
(Click on Topic to Read)
- What is Ethics?
- What is Business Ethics?
- Values, Norms, Beliefs and Standards in Business Ethics
- Indian Ethos in Management
- Ethical Issues in Marketing
- Ethical Issues in HRM
- Ethical Issues in IT
- Ethical Issues in Production and Operations Management
- Ethical Issues in Finance and Accounting
- What is Corporate Governance?
- What is Ownership Concentration?
- What is Ownership Composition?
- Types of Companies in India
- Internal Corporate Governance
- External Corporate Governance
- Corporate Governance in India
- What is Enterprise Risk Management (ERM)?
- What is Assessment of Risk?
- What is Risk Register?
- Risk Management Committee
Corporate social responsibility (CSR)
Lean Six Sigma
- Project Decomposition in Six Sigma
- Critical to Quality (CTQ) Six Sigma
- Process Mapping Six Sigma
- Flowchart and SIPOC
- Gage Repeatability and Reproducibility
- Statistical Diagram
- Lean Techniques for Optimisation Flow
- Failure Modes and Effects Analysis (FMEA)
- What is Process Audits?
- Six Sigma Implementation at Ford
- IBM Uses Six Sigma to Drive Behaviour Change
Research Methodology
Management
Operations Research
Operation Management
- What is Strategy?
- What is Operations Strategy?
- Operations Competitive Dimensions
- Operations Strategy Formulation Process
- What is Strategic Fit?
- Strategic Design Process
- Focused Operations Strategy
- Corporate Level Strategy
- Expansion Strategies
- Stability Strategies
- Retrenchment Strategies
- Competitive Advantage
- Strategic Choice and Strategic Alternatives
- What is Production Process?
- What is Process Technology?
- What is Process Improvement?
- Strategic Capacity Management
- Production and Logistics Strategy
- Taxonomy of Supply Chain Strategies
- Factors Considered in Supply Chain Planning
- Operational and Strategic Issues in Global Logistics
- Logistics Outsourcing Strategy
- What is Supply Chain Mapping?
- Supply Chain Process Restructuring
- Points of Differentiation
- Re-engineering Improvement in SCM
- What is Supply Chain Drivers?
- Supply Chain Operations Reference (SCOR) Model
- Customer Service and Cost Trade Off
- Internal and External Performance Measures
- Linking Supply Chain and Business Performance
- Netflix’s Niche Focused Strategy
- Disney and Pixar Merger
- Process Planning at Mcdonald’s
Service Operations Management
Procurement Management
- What is Procurement Management?
- Procurement Negotiation
- Types of Requisition
- RFX in Procurement
- What is Purchasing Cycle?
- Vendor Managed Inventory
- Internal Conflict During Purchasing Operation
- Spend Analysis in Procurement
- Sourcing in Procurement
- Supplier Evaluation and Selection in Procurement
- Blacklisting of Suppliers in Procurement
- Total Cost of Ownership in Procurement
- Incoterms in Procurement
- Documents Used in International Procurement
- Transportation and Logistics Strategy
- What is Capital Equipment?
- Procurement Process of Capital Equipment
- Acquisition of Technology in Procurement
- What is E-Procurement?
- E-marketplace and Online Catalogues
- Fixed Price and Cost Reimbursement Contracts
- Contract Cancellation in Procurement
- Ethics in Procurement
- Legal Aspects of Procurement
- Global Sourcing in Procurement
- Intermediaries and Countertrade in Procurement
Strategic Management
- What is Strategic Management?
- What is Value Chain Analysis?
- Mission Statement
- Business Level Strategy
- What is SWOT Analysis?
- What is Competitive Advantage?
- What is Vision?
- What is Ansoff Matrix?
- Prahalad and Gary Hammel
- Strategic Management In Global Environment
- Competitor Analysis Framework
- Competitive Rivalry Analysis
- Competitive Dynamics
- What is Competitive Rivalry?
- Five Competitive Forces That Shape Strategy
- What is PESTLE Analysis?
- Fragmentation and Consolidation Of Industries
- What is Technology Life Cycle?
- What is Diversification Strategy?
- What is Corporate Restructuring Strategy?
- Resources and Capabilities of Organization
- Role of Leaders In Functional-Level Strategic Management
- Functional Structure In Functional Level Strategy Formulation
- Information And Control System
- What is Strategy Gap Analysis?
- Issues In Strategy Implementation
- Matrix Organizational Structure
- What is Strategic Management Process?
Supply Chain

