
Measures of Relationship
The measures of relationship study the relationship between two or more variables in a given data series. When you study the relationship between two variables in a population, it is known as bivariate population. When you study more than two variables in a population, it is known as multivariate population. The relationship among variables can be of two types – correlation and cause and effect. Based on these relationships, there are two types of analysis namely Correlation Analysis and Regression Analysis.
Table of Content
Type of Relationship
Correlation Analysis
Correlation analysis is used to study the association between different types of variables. It measures the extent to which one variable is linearly related to the other variables. Different tools are used to study the correlation pattern between variables. These include: Rank correlation and Simple correlation. Let us discuss each tool.
Rank Correlation
Rank correlation refers to the correlation between two data series in which the data is ranked. Generally, it is found when the data is qualitative in nature. It was given by Charles Spearman. Therefore, it is also known as Spearman’s coefficient of correlation. It calculates the degree of relationship between two types of variables.
The formula to calculate rank correlation is as follows:
Where, di = Difference between the individual/ith pair of variables
n = Number of pairs of observations
Simple Correlation
Simple correlation is used to find the degree of linear relationship between two variables. It is the most commonly used measure to describe relationship between two linearly related variables. It was given by Karl Pearson. Therefore, it is also known as Karl Pearson’s coefficient of correlation.
Simple correlation can be of three types, as given in Figure:
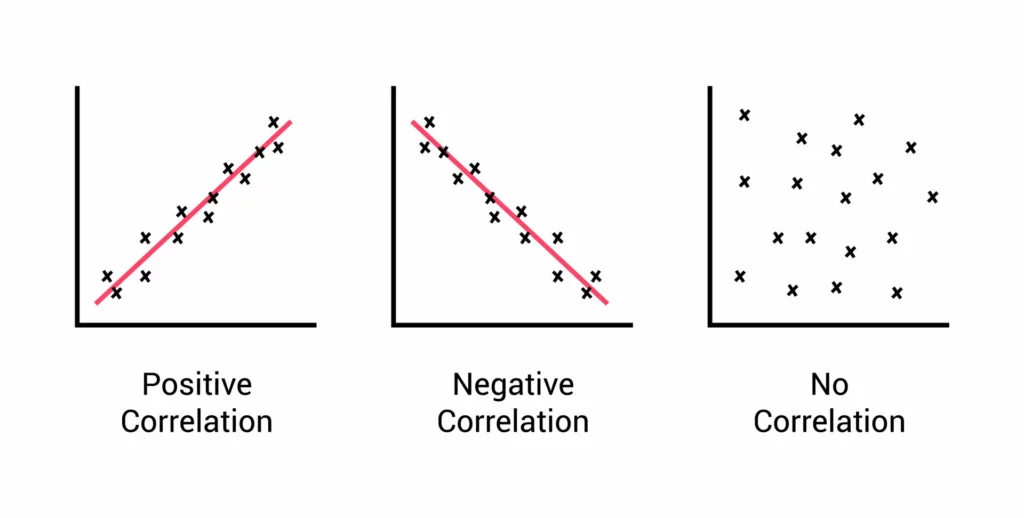
The strength of association between two variables depends on the calculated value of the correlation coefficient and the sample size. The value of the correlation coefficient lies between a range of –1 and +1.
- If the value of the correlation coefficient is close to –1 and the sample size is sufficiently large, then there is a strong negative correlation between two variables. For example, if the coefficient of correlation is –0.8, then there is a strong negative association between variables.
- If the value of the correlation coefficient is close to +1 and the sample size is sufficiently large, then there is a strong positive correlation between two variables. For example, if the coefficient of correlation is 0.8, then there is a strong positive association between variables.
- If the correlation coefficient is not close to –1 or + 1 and the sample size is sufficiently large, then there is weak correlation between two variables. For example, if the coefficient of correlation is 0.3 or –0.3, then the association between variables is weak.
The formula used to calculate simple correlation is as follows:

Where, Xi = ith value of X variable
X = Mean of X variable
Yi = ith value of Y variable
Y = Mean of Y variable
n = Number of pairs of observations
Sx = Standard deviation of X
Sy = Standard deviation of Y
Let us learn to calculate simple correlation between two variables with the help of an example. Suppose you want to study the correlation between the age and weight of a group of people to find out the relation between the two.
Table shows the data:
| Number of Observations | Age (Xi) | Weight(Yi) | Xi2 | Yi2 | XiYi |
|---|---|---|---|---|---|
| 1 | 18 | 35 | 324 | 1225 | 630 |
| 2 | 20 | 38 | 400 | 1444 | 760 |
| 3 | 25 | 50 | 625 | 2500 | 1250 |
| 4 | 30 | 65 | 900 | 4225 | 1950 |
| 5 | 35 | 70 | 1225 | 4900 | 2450 |
| 6 | 24 | 50 | 576 | 2500 | 1200 |
| 7 | 17 | 35 | 289 | 1225 | 595 |
| 8 | 16 | 39 | 256 | 1521 | 624 |
| 9 | 49 | 76 | 2401 | 5776 | 3724 |
| 10 | 45 | 72 | 2025 | 5184 | 3240 |
| 11 | 50 | 85 | 2500 | 7225 | 4250 |
| 12 | 18 | 32 | 324 | 1024 | 576 |
| 13 | 20 | 34 | 400 | 1156 | 680 |
| 14 | 25 | 57 | 625 | 3249 | 1425 |
| 15 | 24 | 50 | 576 | 2500 | 1200 |
| 16 | 17 | 35 | 289 | 1225 | 595 |
| 17 | 16 | 39 | 256 | 1521 | 624 |
| 18 | 23 | 44 | 529 | 1936 | 1012 |
| 19 | 22 | 45 | 484 | 2025 | 990 |
| 20 | 34 | 60 | 1156 | 3600 | 2040 |
| 21 | 36 | 65 | 1296 | 4225 | 2340 |
| 22 | 31 | 63 | 961 | 3969 | 1953 |
| 23 | 43 | 70 | 1849 | 4900 | 3010 |
| 24 | 44 | 72 | 1936 | 5184 | 3168 |
| 25 | 16 | 35 | 256 | 1225 | 560 |
| Total | ∑Xi=698 | ∑Yi=1316 | ∑Xi2=22458 | ∑Yi2=75464 | ∑XiYi=40846 |
The calculation of correlation is as follows:

r = (25 × 40846 – 698 × 1316)/√ (25 × 22458 – 698 × 698) (25 × 75464 – 1316 × 1316)
r = 102582/√74246 × 154744
r = 0.96
Regression Analysis
Correlation need not necessarily imply causality. But it can be said that if correlation between any two variables is very high, then it might be indicative of causality, i.e., a situation where one variable denotes the cause and the other variable denotes its effect. For example, if X and Y are correlated, the causal relationship inferred from correlation between them may indicate that, X is a cause of Y, Y is a cause of X, or both X and Y are caused by some other variable Z, etc.
Correlations are employed through methods such as regression analysis. In order to understand In common parlance, regression analysis (whether simple or multiple) is also termed as causal analysis. Causality between different variables can be understood using causal analysis. Cause and effect analysis is measured using simple regression or multiple regression. Regression is one step ahead of correlation in identification of relationship between two variables.
This is because regression allows for prediction of values within the given data range. In simple language, if we know X, we can predict Y and if we know Y, you can predict X. This is possible with the help of an equation called regression equation. The variable Y is generally termed as dependent or criterion variable and the variable X is termed as independent or predictor variable.
Regression equation is used to generally predict the values of Y based on the values of X. However, it cannot be rightly said that Y is caused by X. Before making such an interpretation, it is extremely imperative for the researcher to thoroughly understand the variables under study and the circumstances or context under which they operate.
The regression equation can be written as below:
Y = α + βX
Where,
Y represents scores on Y variable
X represents scores on X variable
α represents regression constant in the sample
β represents regression coefficient in the sample
α and β are calculated with the following formula:
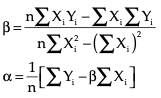
Simple regression analysis is useful in a number of situations, for example, it is used in analysing the relationship between number of consumers (independent variable) and product sales of a month (dependent variable). The regression equation to the data is fitted with the use of least squares method in regression analysis.
Business Ethics
(Click on Topic to Read)
- What is Ethics?
- What is Business Ethics?
- Values, Norms, Beliefs and Standards in Business Ethics
- Indian Ethos in Management
- Ethical Issues in Marketing
- Ethical Issues in HRM
- Ethical Issues in IT
- Ethical Issues in Production and Operations Management
- Ethical Issues in Finance and Accounting
- What is Corporate Governance?
- What is Ownership Concentration?
- What is Ownership Composition?
- Types of Companies in India
- Internal Corporate Governance
- External Corporate Governance
- Corporate Governance in India
- What is Enterprise Risk Management (ERM)?
- What is Assessment of Risk?
- What is Risk Register?
- Risk Management Committee
Corporate social responsibility (CSR)
Lean Six Sigma
- Project Decomposition in Six Sigma
- Critical to Quality (CTQ) Six Sigma
- Process Mapping Six Sigma
- Flowchart and SIPOC
- Gage Repeatability and Reproducibility
- Statistical Diagram
- Lean Techniques for Optimisation Flow
- Failure Modes and Effects Analysis (FMEA)
- What is Process Audits?
- Six Sigma Implementation at Ford
- IBM Uses Six Sigma to Drive Behaviour Change
Research Methodology
Management
Operations Research
Operation Management
- What is Strategy?
- What is Operations Strategy?
- Operations Competitive Dimensions
- Operations Strategy Formulation Process
- What is Strategic Fit?
- Strategic Design Process
- Focused Operations Strategy
- Corporate Level Strategy
- Expansion Strategies
- Stability Strategies
- Retrenchment Strategies
- Competitive Advantage
- Strategic Choice and Strategic Alternatives
- What is Production Process?
- What is Process Technology?
- What is Process Improvement?
- Strategic Capacity Management
- Production and Logistics Strategy
- Taxonomy of Supply Chain Strategies
- Factors Considered in Supply Chain Planning
- Operational and Strategic Issues in Global Logistics
- Logistics Outsourcing Strategy
- What is Supply Chain Mapping?
- Supply Chain Process Restructuring
- Points of Differentiation
- Re-engineering Improvement in SCM
- What is Supply Chain Drivers?
- Supply Chain Operations Reference (SCOR) Model
- Customer Service and Cost Trade Off
- Internal and External Performance Measures
- Linking Supply Chain and Business Performance
- Netflix’s Niche Focused Strategy
- Disney and Pixar Merger
- Process Planning at Mcdonald’s
Service Operations Management
Procurement Management
- What is Procurement Management?
- Procurement Negotiation
- Types of Requisition
- RFX in Procurement
- What is Purchasing Cycle?
- Vendor Managed Inventory
- Internal Conflict During Purchasing Operation
- Spend Analysis in Procurement
- Sourcing in Procurement
- Supplier Evaluation and Selection in Procurement
- Blacklisting of Suppliers in Procurement
- Total Cost of Ownership in Procurement
- Incoterms in Procurement
- Documents Used in International Procurement
- Transportation and Logistics Strategy
- What is Capital Equipment?
- Procurement Process of Capital Equipment
- Acquisition of Technology in Procurement
- What is E-Procurement?
- E-marketplace and Online Catalogues
- Fixed Price and Cost Reimbursement Contracts
- Contract Cancellation in Procurement
- Ethics in Procurement
- Legal Aspects of Procurement
- Global Sourcing in Procurement
- Intermediaries and Countertrade in Procurement
Strategic Management
- What is Strategic Management?
- What is Value Chain Analysis?
- Mission Statement
- Business Level Strategy
- What is SWOT Analysis?
- What is Competitive Advantage?
- What is Vision?
- What is Ansoff Matrix?
- Prahalad and Gary Hammel
- Strategic Management In Global Environment
- Competitor Analysis Framework
- Competitive Rivalry Analysis
- Competitive Dynamics
- What is Competitive Rivalry?
- Five Competitive Forces That Shape Strategy
- What is PESTLE Analysis?
- Fragmentation and Consolidation Of Industries
- What is Technology Life Cycle?
- What is Diversification Strategy?
- What is Corporate Restructuring Strategy?
- Resources and Capabilities of Organization
- Role of Leaders In Functional-Level Strategic Management
- Functional Structure In Functional Level Strategy Formulation
- Information And Control System
- What is Strategy Gap Analysis?
- Issues In Strategy Implementation
- Matrix Organizational Structure
- What is Strategic Management Process?
Supply Chain


