
What is Measure of Skewness?
A frequency distribution can be represented by drawing a curve or a graph. The measure of skewness is used to study the shape of a curve that can be drawn by plotting the data of a frequency distribution on a graph.
As you have learned in the preceding sections, through a measure of central tendency, you measure the concentration of values of a data series in the middle of a frequency distribution. Through a measure of dispersion, you measure the scattering of values near the middle value of the data series.
toc]
It may be possible that two data series, which are widely different in nature and composition, have the same mean and standard deviation. However, when you plot the data of such series on graphs, you obtain curves with different shapes. This shows that the measures of central tendency and dispersion are not sufficient to study the frequency distribution of a data series because they do not talk about the shape of the frequency distribution curves.
Therefore, you need skewness to gain understanding of the different shapes of various frequency distribution curves. The measure of skewness is used when the concentration of values of a data series is more on a single side that is either positive or negative. Skewness can be classified as positive skewness and negative skewness.
This is shown in Figure:
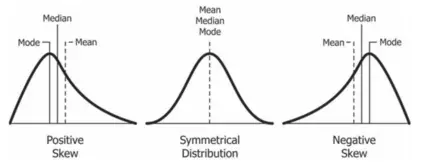
Positive skewness implies that the concentration of values is on the right side of the curve, whereas negative skewness implies that the concentration of values is on the left side of the curve. Skewness is calculated by taking the difference of mean and mode. In positive skewness, the values of these three measures of central tendency are in the following order:
Mean (X) > Median (M) > Mode (Z)
However, in the case of negative skewness, the values of these three measures of central tendency are in the following order:
Mean (X) < Median (M) < Mode (Z)
The formula to calculate skewness is as follows:
Skewness = X – Z
The coefficient of skewness is the relative measure of skewness that can be calculated by dividing skewness with standard deviation. The formula used to calculate the coefficient of skewness is as follows:
Coefficient of Skewness = k X – Z S =
For a moderately skewed, if there is more than one mode or if there is no mode, then you need to calculate skewness and the coefficient of skewness using the method of moments. Let us now calculate skewness and the coefficient of skewness with the help of an example.
Suppose you want to calculate the skewness and the coefficient of skewness of the data given in Table:
| People | Age (Years) | (Xi -X) | (Xi -X)2 |
|---|---|---|---|
| Jenny | 18 | 0.2 | 0.04 |
| Robert | 17 | -0.8 | 0.64 |
| Ella | 18 | 0.2 | 0.04 |
| Andy | 17 | -0.8 | 0.64 |
| Eliza | 19 | 1.2 | 1.44 |
| Total | ∑Xi = 89 | ∑(Xi –X)2 = 2.80 |
The mean of age is calculated as follows:
Mean of Age, X = ∑Xi /n
X = 89/5
X = 17.8
The median of age is calculated as follows:
Median, M = Value of (n + 1/2)th observation
M = (5 + 1/2)th observation
M = 3rd observation = 18
Since the data contains two modes (17 and 18), you do not consider mode in this case.
The SD of age is calculated as follows:
σ = √∑ (Xi – X)2 /n
= √2.80/5 ≅ 0.75
Skewness is calculated as follows:
Skewness = 3(17.8 – 18) = 0.6
The coefficient of skewness is calculated as follows:
Coefficient of Skewness = 0.6/0.75 = 0.8
The skewness in the age of five friends is 0.6 and the relative measure of skewness is 0.8.
Business Ethics
(Click on Topic to Read)
- What is Ethics?
- What is Business Ethics?
- Values, Norms, Beliefs and Standards in Business Ethics
- Indian Ethos in Management
- Ethical Issues in Marketing
- Ethical Issues in HRM
- Ethical Issues in IT
- Ethical Issues in Production and Operations Management
- Ethical Issues in Finance and Accounting
- What is Corporate Governance?
- What is Ownership Concentration?
- What is Ownership Composition?
- Types of Companies in India
- Internal Corporate Governance
- External Corporate Governance
- Corporate Governance in India
- What is Enterprise Risk Management (ERM)?
- What is Assessment of Risk?
- What is Risk Register?
- Risk Management Committee
Corporate social responsibility (CSR)
Lean Six Sigma
- Project Decomposition in Six Sigma
- Critical to Quality (CTQ) Six Sigma
- Process Mapping Six Sigma
- Flowchart and SIPOC
- Gage Repeatability and Reproducibility
- Statistical Diagram
- Lean Techniques for Optimisation Flow
- Failure Modes and Effects Analysis (FMEA)
- What is Process Audits?
- Six Sigma Implementation at Ford
- IBM Uses Six Sigma to Drive Behaviour Change
Research Methodology
Management
Operations Research
Operation Management
- What is Strategy?
- What is Operations Strategy?
- Operations Competitive Dimensions
- Operations Strategy Formulation Process
- What is Strategic Fit?
- Strategic Design Process
- Focused Operations Strategy
- Corporate Level Strategy
- Expansion Strategies
- Stability Strategies
- Retrenchment Strategies
- Competitive Advantage
- Strategic Choice and Strategic Alternatives
- What is Production Process?
- What is Process Technology?
- What is Process Improvement?
- Strategic Capacity Management
- Production and Logistics Strategy
- Taxonomy of Supply Chain Strategies
- Factors Considered in Supply Chain Planning
- Operational and Strategic Issues in Global Logistics
- Logistics Outsourcing Strategy
- What is Supply Chain Mapping?
- Supply Chain Process Restructuring
- Points of Differentiation
- Re-engineering Improvement in SCM
- What is Supply Chain Drivers?
- Supply Chain Operations Reference (SCOR) Model
- Customer Service and Cost Trade Off
- Internal and External Performance Measures
- Linking Supply Chain and Business Performance
- Netflix’s Niche Focused Strategy
- Disney and Pixar Merger
- Process Planning at Mcdonald’s
Service Operations Management
Procurement Management
- What is Procurement Management?
- Procurement Negotiation
- Types of Requisition
- RFX in Procurement
- What is Purchasing Cycle?
- Vendor Managed Inventory
- Internal Conflict During Purchasing Operation
- Spend Analysis in Procurement
- Sourcing in Procurement
- Supplier Evaluation and Selection in Procurement
- Blacklisting of Suppliers in Procurement
- Total Cost of Ownership in Procurement
- Incoterms in Procurement
- Documents Used in International Procurement
- Transportation and Logistics Strategy
- What is Capital Equipment?
- Procurement Process of Capital Equipment
- Acquisition of Technology in Procurement
- What is E-Procurement?
- E-marketplace and Online Catalogues
- Fixed Price and Cost Reimbursement Contracts
- Contract Cancellation in Procurement
- Ethics in Procurement
- Legal Aspects of Procurement
- Global Sourcing in Procurement
- Intermediaries and Countertrade in Procurement
Strategic Management
- What is Strategic Management?
- What is Value Chain Analysis?
- Mission Statement
- Business Level Strategy
- What is SWOT Analysis?
- What is Competitive Advantage?
- What is Vision?
- What is Ansoff Matrix?
- Prahalad and Gary Hammel
- Strategic Management In Global Environment
- Competitor Analysis Framework
- Competitive Rivalry Analysis
- Competitive Dynamics
- What is Competitive Rivalry?
- Five Competitive Forces That Shape Strategy
- What is PESTLE Analysis?
- Fragmentation and Consolidation Of Industries
- What is Technology Life Cycle?
- What is Diversification Strategy?
- What is Corporate Restructuring Strategy?
- Resources and Capabilities of Organization
- Role of Leaders In Functional-Level Strategic Management
- Functional Structure In Functional Level Strategy Formulation
- Information And Control System
- What is Strategy Gap Analysis?
- Issues In Strategy Implementation
- Matrix Organizational Structure
- What is Strategic Management Process?
Supply Chain


