
What is Measure of Dispersion?
Using different measures of central tendency, you can find out the mean value, but these measures do not explain the scattering of values near the mid value in a data series. The measures of dispersion can be used to study the dispersed values near the mean value.
Let us now discuss each measure of dispersion.
Range
Range represents the difference between the highest value and the lowest value in a data series. It is considered as a rough measure of variability because it depends on the size of the data series. When the highest (H) and/or the lowest (L) data point in a data series changes , the range also changes.
Coefficient Range = H – L / H + L
The formula used to calculate range is as follows:
Range = (Highest value of data series – Lowest value of data series)
Let us learn to calculate range with the help of the preceding example in which a group of 17 people rated a book on a 5-pointer scale, where 1 is the lowest rating and 5 is the highest rating. The rating given by the 17 people is as follows:
2, 5, 3, 4, 1, 5, 4, 3, 1, 2, 5, 4, 3, 2, 1, 5, 4
Now, you want to calculate the range for the data series.
To do so, you need to find the highest and lowest values of the data series. In the present case,
Highest value of data series = 5
Lowest value of data series = 1
Therefore, the range would be:
Range= (Highest value of data series – lowest value of data series)
Range = (5 – 1)
Range = 4
Therefore, the range of the ratings given by 17 people to a book is 4.
Mean Deviation
Mean deviation represents the extent of deviation of values from the mean. According to Clark and Schkade, average deviation is the average amount of scatter of the items in a distribution from either the mean or the median, ignoring the signs of the deviations. The average that is taken of the scatter is an arithmetic mean, which accounts for the fact that this measure is often called the mean deviation. Mean Deviation is used to measure variability across a data series.
The formula used to calculate Mean Deviation is as follows:
Mean Deviation (MD) = ∑|Xi – X|/n
Where Xi = Individual observation
X = Mean/Median/Mode
n = Number of observations
With the help of MD, you can also calculate the coefficient of MD. The coefficient of MD refers to the relative measure of dispersion that can be calculated by dividing MD with mean/median/mode.
The formula to calculate the coefficient of mean deviation is as follows:
Coefficient of MD = MD/X
Where M.D = Mean Deviation
X = Mean/Median/Mode
Let us understand the concept of MD and the coefficient of MD with the help of an earlier example in which you calculated the average weight of five friends. Table 8.2 shows the data used for calculating mean deviation:
| People | Weight (kg) | |Xi – X| |
|---|---|---|
| Jenny | 35 | |35 – 38| = 3 |
| People | Weight (kg) | |Xi – X| |
| Robert | 40 | |40 – 38| = 2 |
| Ella | 34 | |34 – 38| = 4 |
| Andy | 39 | |39 – 38| = 1 |
| Eliza | 42 | |42 – 38| = 4 |
| Total | 14 |
X = 35 + 40 + 34 + 39 + 42 / 5 = 38
The formula to calculate MD is shown as follows:
Mean Deviation (M.D.) = ∑|Xi – X|/n
M.D. = 14/5
M.D. = 2.8
Coefficient of Mean Deviation = M.D./X
= 2.8/38
= 0.074
Therefore, the dispersion of the weight of five friends from the mean value is 2.8, Therefore, the weight of all friends is dispersed more or less by 2.8 kg from the average weight. The relative measure of weight is 0.074.
Standard Deviation
Standard Deviation is used to calculate the scattering of values in a given dataset. The symbol used to represent standard deviation is sigma (σ). Standard Deviation (SD) is the square root of variance of a data series. The formula used to calculate SD is as follows:
For research where entire population is considered,
SD of population σ = ( )
and σ = Parameter of the population
For research where only a sample is considered,
SD of Sample S = ( )
and S = Statistic of sample
Also not that the square of SD is called variance
Population variance = σ2 and Sample variance = S
Sample statics is used to estimate population parameter. S2 is an unbiased estimate of σ2 .
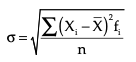
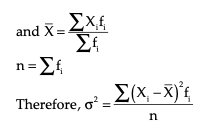
If the observations are grouped into a frequency table, than the formula of SD and variance change as follow:
The coefficient of SD can be calculated by dividing SD with the mean of the series. It is a relative measure of dispersion. Let us understand the concepts of SD, the coefficient of SD, and the coefficient of variance with the help of an example. Suppose you want to calculate the standard deviation of the weight of five friends shown in the preceding example.
Business Ethics
(Click on Topic to Read)
- What is Ethics?
- What is Business Ethics?
- Values, Norms, Beliefs and Standards in Business Ethics
- Indian Ethos in Management
- Ethical Issues in Marketing
- Ethical Issues in HRM
- Ethical Issues in IT
- Ethical Issues in Production and Operations Management
- Ethical Issues in Finance and Accounting
- What is Corporate Governance?
- What is Ownership Concentration?
- What is Ownership Composition?
- Types of Companies in India
- Internal Corporate Governance
- External Corporate Governance
- Corporate Governance in India
- What is Enterprise Risk Management (ERM)?
- What is Assessment of Risk?
- What is Risk Register?
- Risk Management Committee
Corporate social responsibility (CSR)
Lean Six Sigma
- Project Decomposition in Six Sigma
- Critical to Quality (CTQ) Six Sigma
- Process Mapping Six Sigma
- Flowchart and SIPOC
- Gage Repeatability and Reproducibility
- Statistical Diagram
- Lean Techniques for Optimisation Flow
- Failure Modes and Effects Analysis (FMEA)
- What is Process Audits?
- Six Sigma Implementation at Ford
- IBM Uses Six Sigma to Drive Behaviour Change
Research Methodology
Management
Operations Research
Operation Management
- What is Strategy?
- What is Operations Strategy?
- Operations Competitive Dimensions
- Operations Strategy Formulation Process
- What is Strategic Fit?
- Strategic Design Process
- Focused Operations Strategy
- Corporate Level Strategy
- Expansion Strategies
- Stability Strategies
- Retrenchment Strategies
- Competitive Advantage
- Strategic Choice and Strategic Alternatives
- What is Production Process?
- What is Process Technology?
- What is Process Improvement?
- Strategic Capacity Management
- Production and Logistics Strategy
- Taxonomy of Supply Chain Strategies
- Factors Considered in Supply Chain Planning
- Operational and Strategic Issues in Global Logistics
- Logistics Outsourcing Strategy
- What is Supply Chain Mapping?
- Supply Chain Process Restructuring
- Points of Differentiation
- Re-engineering Improvement in SCM
- What is Supply Chain Drivers?
- Supply Chain Operations Reference (SCOR) Model
- Customer Service and Cost Trade Off
- Internal and External Performance Measures
- Linking Supply Chain and Business Performance
- Netflix’s Niche Focused Strategy
- Disney and Pixar Merger
- Process Planning at Mcdonald’s
Service Operations Management
Procurement Management
- What is Procurement Management?
- Procurement Negotiation
- Types of Requisition
- RFX in Procurement
- What is Purchasing Cycle?
- Vendor Managed Inventory
- Internal Conflict During Purchasing Operation
- Spend Analysis in Procurement
- Sourcing in Procurement
- Supplier Evaluation and Selection in Procurement
- Blacklisting of Suppliers in Procurement
- Total Cost of Ownership in Procurement
- Incoterms in Procurement
- Documents Used in International Procurement
- Transportation and Logistics Strategy
- What is Capital Equipment?
- Procurement Process of Capital Equipment
- Acquisition of Technology in Procurement
- What is E-Procurement?
- E-marketplace and Online Catalogues
- Fixed Price and Cost Reimbursement Contracts
- Contract Cancellation in Procurement
- Ethics in Procurement
- Legal Aspects of Procurement
- Global Sourcing in Procurement
- Intermediaries and Countertrade in Procurement
Strategic Management
- What is Strategic Management?
- What is Value Chain Analysis?
- Mission Statement
- Business Level Strategy
- What is SWOT Analysis?
- What is Competitive Advantage?
- What is Vision?
- What is Ansoff Matrix?
- Prahalad and Gary Hammel
- Strategic Management In Global Environment
- Competitor Analysis Framework
- Competitive Rivalry Analysis
- Competitive Dynamics
- What is Competitive Rivalry?
- Five Competitive Forces That Shape Strategy
- What is PESTLE Analysis?
- Fragmentation and Consolidation Of Industries
- What is Technology Life Cycle?
- What is Diversification Strategy?
- What is Corporate Restructuring Strategy?
- Resources and Capabilities of Organization
- Role of Leaders In Functional-Level Strategic Management
- Functional Structure In Functional Level Strategy Formulation
- Information And Control System
- What is Strategy Gap Analysis?
- Issues In Strategy Implementation
- Matrix Organizational Structure
- What is Strategic Management Process?
Supply Chain

