
What is Sample Size?
Sample size refers to the number of individual units or observations selected from a larger population for a particular study or analysis. In research and statistical analysis, a sample is a subset of the population of interest that is studied to draw conclusions or make inferences about the larger population. The size of the sample has implications for the reliability and generalizability of the findings.
Table of Content
Concept of Sample Size
The number of individuals or observations included in a study is referred to as sample size. Letter ‘n’ is commonly used to indicate this number. The sample size has an impact on two statistical properties:
- accuracy of research calculations; and
- researcher’s ability to make conclusions
For example, we can compare the performance of marathon runners who eat oatmeal for morning to those who do not. We have no choice but to focus on a subset of the greater population because it would be difficult to track the food habits of every marathon runner on the planet. If only 100 runners are chosen at random for our investigation, the sample size is ‘n’. Based on the data collected from a sample of 100 runners, the conclusions of the study might be applied to the entire population of runners.
There will always be some margin of error in the study outcomes, no matter how meticulously the sample of 100 runners is selected. This is because we have not spoken to everyone in our target audience. We cannot be certain how eating oatmeal impacts running performance because it is impossible to look at every situation in which the two activities collide. Sampling error is the term for this type of error.
It has an impact on the precision with which we describe the population of all runners. Although sampling error is unavoidable, it can be mitigated by increasing sample size. A narrower margin of error is related to larger samples. This is reasonable. We need a lot of samples to compare and contrast in order to gain an accurate picture of the impact of eating oatmeal on running performance. However, there comes the point where increasing the sample size has no effect on sampling error. The rule of decreasing returns is the name for this occurrence.
Sample Size Determination
The number of subjects included in a sample is referred to as the sample size. When we talk about sample size, we’re talking about a group of people chosen from the general population and considered representative of the real population for that particular study. For instance, if we want to forecast how a specific age group would react to a new product, we can test it first on a sample size that is typical of the target demographic. In this situation, the sample size will be determined by the number of people in that age group who will be polled.
Sample Size Calculation
The use of statistical formula to determine sample size entails, first and foremost, the selection of a significant benchmark for the measurements to be taken based on the findings of the qualitative study to be conducted. The researcher can keep a track of how variables are measured and identify precise indicators that show how they are changing. Thus, in the specialist literature, the researcher can follow the determination of the frequency of visits of a commercial unit and the appropriate indicator characterising this variable to be the weekly average frequency of visiting the group in question.
Sample Size Formula
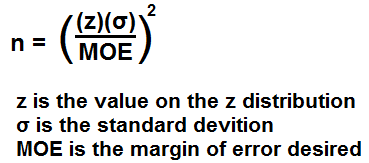
In studies where the mean of a continuous outcome variable in a single population is to be estimated, the following formula is used for determining sample size:

Where
Z = The value from the standard normal distribution reflecting the confidence level that will be used (e.g., Z = 1.96 for 95%)
σ = Standard deviation of the outcome variable
E = The desired margin of error
The formula above generates the minimum number of subjects required to ensure that the margin of error in the confidence interval for μ does not exceed E.
On the other hand, in studies where the plan is to estimate the proportion of successes in a dichotomous outcome variable (yes/no) in a single population, the following formula is used for determining sample size:
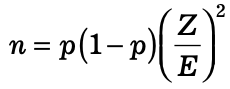
Where
Z = The value from the standard normal distribution reflecting the confidence level that will be used (e.g., Z = 1.96 for 95%)
E = The desired margin of error
p = The proportion of successes in the population
Here, the aim is conduct a study to generate a 95% confidence interval for the unknown population proportion, p. The equation to determine the sample size for determining p seems to require knowledge of p, but this is obviously a circular argument as a study would not have been required if the proportion of successes in the population had been known. Thus, an approximate value of ‘p’ or an anticipated value is required.
The range of p is 0 to 1, and therefore the range of p(1-p) is 0 to 1. The value of p that maximizes p(1-p) is p=0.5. Consequently, if there is no information available to approximate p, then p=0.5 can be used to generate the most conservative, or largest, sample size.
Let us understand the calculation of sample size using both the formulas with the help of examples.
Example 1: A company wants to a make a ventricular assist device for children with a congenital heart disease between the ages of 3 and 5 having a congenital heart disease. For this, the company wants to estimate the mean diastolic blood pressure in children between the ages of 3 and 5 having a congenital heart disease. How many children should be enrolled in the study by the investigator?
Note: The investigator appointed by the company plans on using a 95% confidence interval (so Z=1.96) and wants a margin of error of 5 units. The standard deviation of diastolic blood pressure is not known, but the investigators conduct a literature search and find that the standard deviation of diastolic blood pressures in children with other cardiac defects is between 15 and 20. To estimate the sample size, we consider the larger standard deviation in order to obtain the most conservative (largest) sample size.
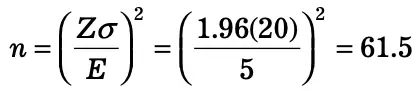
In order to ensure that the 95% confidence interval estimate of the mean diastolic blood pressure in children between the ages of 3 and 5 with a congenital heart disease is within 5 units of the true mean, a sample of size 62 is needed.
Procedure for Determining Sample Size
Sampling and surveys are generally conducted in order to generalise the findings of the research for the entire target population. However, there is a relation between the sample size and the accuracy of the research. The larger the sample size, the more accurate the research findings will be. Therefore, it is important to carefully determine the size of sample to be used for research. If the sample chosen is very small, it will have more errors and if the sample is very large, it might lead to wastage of time, money and effort.
Before, determining the sample size, it is important to have information regarding the following aspects:
- Population size: In order to determine the sample size, the population size must be known.
- Confidence interval (margin of error): The allowable error or the percentage of error that is allowed in a sample is represented by the confidence interval. Confidence interval determines the allowable difference between the population mean and the sample mean.
- Confidence level: It refers to the percentage confidence that the sample mean falls within the given confidence interval. Three most common confidence intervals include 90%, 95% and 99%.
- Standard deviation: It refers to the standard deviation that a researcher may expect in his responses for the variable of interest.
Now, we can calculate the sample size in the following manner. First, find out the Z-score or the constant value that represents the confidence level corresponding to a Z-score. The Z-scores for the corresponding confidence levels can be found using the Z-score table. Z-score for 90% confidence level is 1.645; Z-score for 95% confidence level is 1.96; and Z-score for 99% confidence level is 2.576.
Now, insert the values of Z-score, confidence interval and standard deviation in the formula to calculate the sample size:
Required sample size = n
The target population must be defined with extreme caution to prevent either the tendency to choose an unjustifiably big population or the tendency to choose an unjustifiably small population. For example, in automotive manufacturing enterprises, the overall population can be made up of people from all over the country, including children of various ages.
However, the relevant group, which will be the focus of the study, will consist solely of people above the age of 18. There can be no admission of an unjustifiably restricted population, such as men between the ages of 25 and 50. This may cover a huge portion of the automobile market, but it leaves out several crucial groups.
Business Ethics
(Click on Topic to Read)
- What is Ethics?
- What is Business Ethics?
- Values, Norms, Beliefs and Standards in Business Ethics
- Indian Ethos in Management
- Ethical Issues in Marketing
- Ethical Issues in HRM
- Ethical Issues in IT
- Ethical Issues in Production and Operations Management
- Ethical Issues in Finance and Accounting
- What is Corporate Governance?
- What is Ownership Concentration?
- What is Ownership Composition?
- Types of Companies in India
- Internal Corporate Governance
- External Corporate Governance
- Corporate Governance in India
- What is Enterprise Risk Management (ERM)?
- What is Assessment of Risk?
- What is Risk Register?
- Risk Management Committee
Corporate social responsibility (CSR)
Lean Six Sigma
- Project Decomposition in Six Sigma
- Critical to Quality (CTQ) Six Sigma
- Process Mapping Six Sigma
- Flowchart and SIPOC
- Gage Repeatability and Reproducibility
- Statistical Diagram
- Lean Techniques for Optimisation Flow
- Failure Modes and Effects Analysis (FMEA)
- What is Process Audits?
- Six Sigma Implementation at Ford
- IBM Uses Six Sigma to Drive Behaviour Change
Research Methodology
Management
Operations Research
Operation Management
- What is Strategy?
- What is Operations Strategy?
- Operations Competitive Dimensions
- Operations Strategy Formulation Process
- What is Strategic Fit?
- Strategic Design Process
- Focused Operations Strategy
- Corporate Level Strategy
- Expansion Strategies
- Stability Strategies
- Retrenchment Strategies
- Competitive Advantage
- Strategic Choice and Strategic Alternatives
- What is Production Process?
- What is Process Technology?
- What is Process Improvement?
- Strategic Capacity Management
- Production and Logistics Strategy
- Taxonomy of Supply Chain Strategies
- Factors Considered in Supply Chain Planning
- Operational and Strategic Issues in Global Logistics
- Logistics Outsourcing Strategy
- What is Supply Chain Mapping?
- Supply Chain Process Restructuring
- Points of Differentiation
- Re-engineering Improvement in SCM
- What is Supply Chain Drivers?
- Supply Chain Operations Reference (SCOR) Model
- Customer Service and Cost Trade Off
- Internal and External Performance Measures
- Linking Supply Chain and Business Performance
- Netflix’s Niche Focused Strategy
- Disney and Pixar Merger
- Process Planning at Mcdonald’s
Service Operations Management
Procurement Management
- What is Procurement Management?
- Procurement Negotiation
- Types of Requisition
- RFX in Procurement
- What is Purchasing Cycle?
- Vendor Managed Inventory
- Internal Conflict During Purchasing Operation
- Spend Analysis in Procurement
- Sourcing in Procurement
- Supplier Evaluation and Selection in Procurement
- Blacklisting of Suppliers in Procurement
- Total Cost of Ownership in Procurement
- Incoterms in Procurement
- Documents Used in International Procurement
- Transportation and Logistics Strategy
- What is Capital Equipment?
- Procurement Process of Capital Equipment
- Acquisition of Technology in Procurement
- What is E-Procurement?
- E-marketplace and Online Catalogues
- Fixed Price and Cost Reimbursement Contracts
- Contract Cancellation in Procurement
- Ethics in Procurement
- Legal Aspects of Procurement
- Global Sourcing in Procurement
- Intermediaries and Countertrade in Procurement
Strategic Management
- What is Strategic Management?
- What is Value Chain Analysis?
- Mission Statement
- Business Level Strategy
- What is SWOT Analysis?
- What is Competitive Advantage?
- What is Vision?
- What is Ansoff Matrix?
- Prahalad and Gary Hammel
- Strategic Management In Global Environment
- Competitor Analysis Framework
- Competitive Rivalry Analysis
- Competitive Dynamics
- What is Competitive Rivalry?
- Five Competitive Forces That Shape Strategy
- What is PESTLE Analysis?
- Fragmentation and Consolidation Of Industries
- What is Technology Life Cycle?
- What is Diversification Strategy?
- What is Corporate Restructuring Strategy?
- Resources and Capabilities of Organization
- Role of Leaders In Functional-Level Strategic Management
- Functional Structure In Functional Level Strategy Formulation
- Information And Control System
- What is Strategy Gap Analysis?
- Issues In Strategy Implementation
- Matrix Organizational Structure
- What is Strategic Management Process?
Supply Chain

