
What is Measure of Central Tendency?
A measure of central tendency is a statistical concept that aims to describe the center or typical value of a dataset. It provides a single value that represents the “middle” or “central” value around which the data tend to cluster. The three most commonly used measures of central tendency are the mean, median, and mode. Measures of central tendency, dispersion and skewness are helpful in analysing numerical data. Let us now study about these measures.
Table of Content
Measures of Central Tendency
A measure of central tendency is a precis statistic that represents the middle factor or regular price of a dataset. These measures imply wherein maximum values in a distribution fall and also are called the central area of distribution. You can think about it because of the tendency of statistics to cluster around a centre price. The measures of central tendency are used to study the distribution pattern of a dataset. These measures give a central value that represents the large chunk of data analysed. The central value is nothing but the average of data collected.
Mean
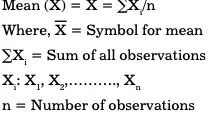
Mean represents the value calculated after dividing the sum of observations by the total number of observations (n) taken. It is also known as arithmetic mean.
The following formula is used to calculate mean:
Let us understand the concept of arithmetic mean with the help of an example. Suppose you want to find the average weight of a group of five friends. Table 8.1 shows the weight of each person in the group:
| People | Weight (kg) |
|---|---|
| Jenny | 35 |
| Robert | 40 |
| Ella | 34 |
| Andy | 39 |
| Eliza | 42 |
The average weight of five friends can be calculated as follows:
X = ∑Xi
/n
Where, X = Average weight of five friends
∑Xi
= Sum of the weights of five friends
∑Xi
= 190
n = 5
X = (35 + 40 + 34 + 39 + 42)/5
X = 190/5
X = 38 kg
Therefore, the average weight of five friends is 38 kg.
You can calculate different types of mean:
Weighted Mean
This mean is calculated after considering the weight attached to each item. The formula used to calculate weighted mean is as follows:
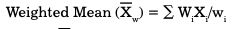
Where, Xw = Symbol for weighted mean
Xi = Value of the ith item
Wi = Weight assigned to the ith item
wi = Number of weights assigned
Example of Weighted Mean
A school grades its students by using weighted mean scores as follows: 15% weightage is assigned for homework, 15% weightage is assigned for extracurricular activities, and 70% weightage is assigned for the examination. Aditya scored 60 marks, 70 marks and 55 marks for homework, extracurricular activities and in examination respectively. Find the weighted score of Aditya if the total score is 100.
Now, you calculate the weighted mean as follows:
Weighted Mean (Xw) = (0.15 × 60) + (0.15 × 70) + (0.70 × 55)
= 9 + 10.5 + 38.5
= 58
Geometric Mean
Geometric mean represents the nth root of the product of all the values or observations involved in a research. The formula used to calculate geometric mean is as follows:
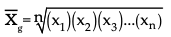
Where X1 , X2…………,Xn are the n observations in the data set
n = Number of observations
Example of Geometric Mean
You want to calculate the geometric mean of four observations: 10, 12, 10 and 11.
The calculation of geometric mean is shown as follows:
X1 = 10, X2 = 12, X3 = 10, X4 = 11
n = 4
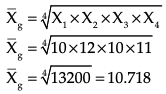
Therefore, the geometric mean of four observations is 10.7 years.
Harmonic Mean
Harmonic mean refers to reciprocal of the average of the reciprocals of the values in a data series (or observations). The formula to calculate harmonic mean is as follows:
Harmonic mean (XH) = Rec. [(Rec. X1 + Rec. X2 +…………. + Rec. Xn)/n]
Where Rec. X1 , Rec. X2 …. Rec. Xn are the Reciprocal of Observations 1, 2, ….., n, respectively
n = Number of observations
Example of Harmonic Mean
Calculate the harmonic mean of four observations: 10, 12, 10 and 11.
Harmonic mean is calculated as:
(XH) = Rec. [(Rec. X1 + Rec. X2 + …………. + Rec. X4 )/n]
Where Rec. X1 = 1/10; Rec. X2 = 1/12, Rec. X3 = 1/10; Rec. X4 = 1/11
n = 4
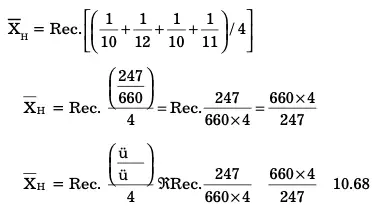
Therefore, the harmonic mean of the four observations is 10.7 years. It is used for units that add up as reciprocals in a sequence such as speed, distance, capacitance in series or resistance in parallel.
Median
Median is defined as a central or mid value of a dataset. Median divides a dataset into two halves – one half contains the values greater than the mid value (or median) and the other half contains the values less than the mid value. Before calculating median, you need to arrange the dataset in the ascending or descending order. The formula to calculate median is as follows:
n = number of observation
Now, if n is an odd number
Now, If n is an even number
Median = Value of {[(n/2)th observation + ((n+1)/2)th ]/2}
Let us understand the concept of median with the help of an example.
A group of 17 people gave the following ratings to a book on a 5-pointer scale (where 1 is the lowest rating and 5 is the highest rating):
2, 5, 3, 4, 1, 5, 4, 3, 1, 2, 5, 4, 3, 2, 1, 5, 4
Now you want to calculate the average rating by using median. To do so, arrange the data in the ascending order, as follows:
1, 1, 1, 2, 2, 2, 3, 3, 3, 4, 4, 4, 4, 5, 5, 5, 5
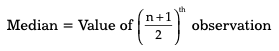
Since the number of observations is odd, the following formula will be used to calculate median
Median = Value of ((n + 1)/2)th observation
Median = ((17 + 1)/2)th observation
Median = 9th observation
Median = 3
Therefore, the median rating for the book is 3.
Now, if n is an even number; then, we calculate median as the simple average of the middle two numbers. In other words, median is the simple average of the (n/2)th and ((n +1)/2 )th terms.
Now, if a group of 20 people gave their ratings to a movie on a 5-point scale as:
2, 5, 3, 4, 1, 5, 4, 3, 1, 2, 5, 4, 3, 2, 1, 5, 4, 1, 2, 3
Where, 1 is the lowest rating and 5 is the highest rating
Now, to calculate the average rating using median, all the 20 observations are arranged in ascending order as:
1, 1, 1, 1, 2, 2, 2, 2, 3, 3, 3, 3, 4, 4, 4, 4, 5, 5, 5, 5
Here, median is the average of middle two values, i.e., values at 10th and 11th positions. This is calculated as:
Median = (3 + 3)/2 = 3
Mode
Mode refers to the value that has the highest frequency in a data series. According to Croxton and Cowden, the mode of a distribution is value at the point around which the items tend to be most heavily concentrated. It may be regarded as the most typical of a series of values. Let us learn to calculate mode with the help of an example. Suppose the marks of five friends in a science paper are 70, 90, 50, 70, and 30. You want to find the mode of their marks.
You need to find the highest frequency of the present data to calculate mode. Here, the number having the highest frequency is 70 as it occurs two times; therefore, the mode of students’ marks is 70. Mode is used as the most important statistic for nominal data where values are names rather than numbers. In such cases, there is no concept of centre because there are no numbers. In addition, when we are dealing with continuous variables, probability that observations occurring in the data sample are different is 1. Therefore, mode cannot be used for continuous variables.
Mode is not considered a true measure of central tendency because of three reasons:
- It is not necessary that one data series has only one mode because many numbers in the data series can have the highest frequency.
- Mode does not consider all the frequencies to arrive at the central value of the data series. Therefore, the results of mode are not reliable.
- It is possible that a series has observations that occur only once. In such cases, mode does not exist.
Let us summarise mean, median and mode as:
- Mean: Mean represents the average value in a dataset.
- Median: Median represents the middle value in a dataset.
- Mode: Mode represents the most common value in a dataset.
Business Ethics
(Click on Topic to Read)
- What is Ethics?
- What is Business Ethics?
- Values, Norms, Beliefs and Standards in Business Ethics
- Indian Ethos in Management
- Ethical Issues in Marketing
- Ethical Issues in HRM
- Ethical Issues in IT
- Ethical Issues in Production and Operations Management
- Ethical Issues in Finance and Accounting
- What is Corporate Governance?
- What is Ownership Concentration?
- What is Ownership Composition?
- Types of Companies in India
- Internal Corporate Governance
- External Corporate Governance
- Corporate Governance in India
- What is Enterprise Risk Management (ERM)?
- What is Assessment of Risk?
- What is Risk Register?
- Risk Management Committee
Corporate social responsibility (CSR)
Lean Six Sigma
- Project Decomposition in Six Sigma
- Critical to Quality (CTQ) Six Sigma
- Process Mapping Six Sigma
- Flowchart and SIPOC
- Gage Repeatability and Reproducibility
- Statistical Diagram
- Lean Techniques for Optimisation Flow
- Failure Modes and Effects Analysis (FMEA)
- What is Process Audits?
- Six Sigma Implementation at Ford
- IBM Uses Six Sigma to Drive Behaviour Change
Research Methodology
Management
Operations Research
Operation Management
- What is Strategy?
- What is Operations Strategy?
- Operations Competitive Dimensions
- Operations Strategy Formulation Process
- What is Strategic Fit?
- Strategic Design Process
- Focused Operations Strategy
- Corporate Level Strategy
- Expansion Strategies
- Stability Strategies
- Retrenchment Strategies
- Competitive Advantage
- Strategic Choice and Strategic Alternatives
- What is Production Process?
- What is Process Technology?
- What is Process Improvement?
- Strategic Capacity Management
- Production and Logistics Strategy
- Taxonomy of Supply Chain Strategies
- Factors Considered in Supply Chain Planning
- Operational and Strategic Issues in Global Logistics
- Logistics Outsourcing Strategy
- What is Supply Chain Mapping?
- Supply Chain Process Restructuring
- Points of Differentiation
- Re-engineering Improvement in SCM
- What is Supply Chain Drivers?
- Supply Chain Operations Reference (SCOR) Model
- Customer Service and Cost Trade Off
- Internal and External Performance Measures
- Linking Supply Chain and Business Performance
- Netflix’s Niche Focused Strategy
- Disney and Pixar Merger
- Process Planning at Mcdonald’s
Service Operations Management
Procurement Management
- What is Procurement Management?
- Procurement Negotiation
- Types of Requisition
- RFX in Procurement
- What is Purchasing Cycle?
- Vendor Managed Inventory
- Internal Conflict During Purchasing Operation
- Spend Analysis in Procurement
- Sourcing in Procurement
- Supplier Evaluation and Selection in Procurement
- Blacklisting of Suppliers in Procurement
- Total Cost of Ownership in Procurement
- Incoterms in Procurement
- Documents Used in International Procurement
- Transportation and Logistics Strategy
- What is Capital Equipment?
- Procurement Process of Capital Equipment
- Acquisition of Technology in Procurement
- What is E-Procurement?
- E-marketplace and Online Catalogues
- Fixed Price and Cost Reimbursement Contracts
- Contract Cancellation in Procurement
- Ethics in Procurement
- Legal Aspects of Procurement
- Global Sourcing in Procurement
- Intermediaries and Countertrade in Procurement
Strategic Management
- What is Strategic Management?
- What is Value Chain Analysis?
- Mission Statement
- Business Level Strategy
- What is SWOT Analysis?
- What is Competitive Advantage?
- What is Vision?
- What is Ansoff Matrix?
- Prahalad and Gary Hammel
- Strategic Management In Global Environment
- Competitor Analysis Framework
- Competitive Rivalry Analysis
- Competitive Dynamics
- What is Competitive Rivalry?
- Five Competitive Forces That Shape Strategy
- What is PESTLE Analysis?
- Fragmentation and Consolidation Of Industries
- What is Technology Life Cycle?
- What is Diversification Strategy?
- What is Corporate Restructuring Strategy?
- Resources and Capabilities of Organization
- Role of Leaders In Functional-Level Strategic Management
- Functional Structure In Functional Level Strategy Formulation
- Information And Control System
- What is Strategy Gap Analysis?
- Issues In Strategy Implementation
- Matrix Organizational Structure
- What is Strategic Management Process?
Supply Chain


