
What is Material Requirements Planning (MRP)?
Material requirements planning (MRP) is a computerized inventory control and production planning system. The main objective of any inventory system is to ensure that material is available when needed—which can easily lead to a tremendous investment of funds in unnecessary inventory. One objective of MRP is to maintain the lowest possible level of inventory. MRP does this by determining when component items are needed and scheduling them to be ready at that time, no earlier and no later.
MRP was the first inventory system to recognize that inventories of raw materials, components, and finished goods may need to be handled differently. In the process of planning inventory levels for these various types of goods, the system also planned purchasing activities (for raw materials and purchased components), manufacturing activities (for parts and assemblies), and delivery schedules (for finished products). Thus, the system was more than an inventory control system; it became a production scheduling system as well.
Table of Content
One of the few certainties in a manufacturing environment is that things rarely go as planned—orders arrive late, machines break down, workers are absent, designs are changed, and so on. With its computerized database, MRP can keep track of the relationship of job orders so that if a delay in one aspect of production is unavoidable, other related activities can be rescheduled, too. MRP systems can keep schedules valid and up to date.
When to Use MRP
MRP is useful for dependent and discrete demand items, complex products, job shop production, and assemble-to-order environments. Managing component demand inventory is different from managing finished goods inventory.
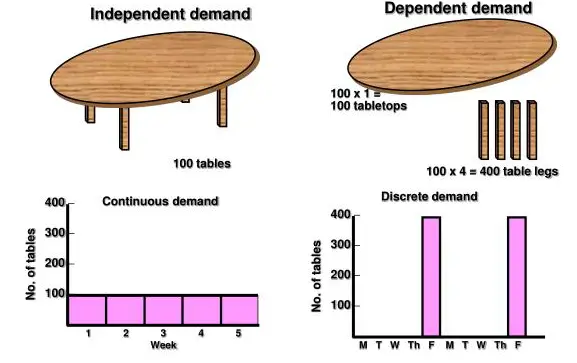
Dependent Demand For one thing, the demand for parts does not have to be forecasted; it can be derived from the demand for the finished product. For example, suppose the demand for a table, consisting of four legs and a tabletop, is 100 units per week. Then, the demand for tabletops would also be 100 per week, and the demand for table legs would be 400 per week.
Demand for table legs is dependent on the demand for tables. The demand for tables may be forecasted, but the demand for table legs is calculated. The tables are an example of independent demand. The tabletop and table legs exhibit dependent demand.
Discrete Demand Another difference between finished products and parts is the continuity of their demand. The inventory systems were designed to keep some inventory on hand at all times—enough, we hoped, to meet each day’s demand. With component items, demand does not necessarily occur continuously.
Let us assume in our table example that table legs are the last items to be assembled onto the tables before shipping. Also, assume that it takes one week to make a batch of tables and that table legs are assembled onto the tabletops every Friday.
If we were to graph the demand for table legs, as shown in Figure 8.1, it would be zero for Monday, Tuesday, Wednesday, and Thursday, but on Friday the demand for table legs would jump to 400. The same pattern would repeat the following week. With this scenario, we do not need to keep an inventory of table legs available on Monday through Thursday of any week. We need table legs only on Fridays.
Looking at our graph, demand for table legs occurs in lumps; it is discrete, not continuous. Using an inventory system such as economic order quantity (EOQ) for component items would result in inventory being held that we know will not be needed until a later date. The excess inventory takes up space, soaks up funds, and requires additional resources for counting, sorting, storing, and moving.
Complex Products Industries that manufacture complex products, requiring the coordination of component production, find MRP especially useful. A complex product may have hundreds of parts, dozens of assemblies, and several levels of assembly. MRP tries to ensure that multiple components of an assembly are ready at the same time so that they can be assembled. Products with simple structures do not need MRP to plan production or monitor inventory levels.
Erratic Orders The advantages of MRP are more evident when the manufacturing environment is complex and uncertain. Manufacturing environments in which customer orders are erratic, each job takes a different path through the system, lead time is uncertain, and due dates vary need an information system such as MRP to keep track of the different jobs and coordinate their schedules.
The type of environment we are describing is characteristic of batch, or job shop, processes. Although MRP is currently available for continuous and repetitive manufacturing, it was designed primarily for systems that produce goods in batches.
Assemble-to-Order Finally, MRP systems are very useful in industries in which the customer is allowed to choose among different options. These products have many common components that are inventoried in some form before the customer order is received.
For example, customers of a well-known electronics firm routinely expect delivery in six weeks on goods that take 28 weeks to manufacture. The manufacturer copes with this seemingly unrealistic demand by producing major assemblies and subassemblies in advance of the customer order and then completing the product on receipt of the order. This type of operation is called assemble-to-order or build-to-order.
Material Requirements Planning
There are three major inputs:
Master Production Schedule
The master production schedule (MPS), also called the master schedule, specifies which end items or finished products a firm is to produce, how many are needed, and when they are needed. Recall that the sales and operations plan is a similar schedule for product lines or families, given by months or quarters of a year. The master production schedule works within the constraints of the aggregate production plan but produces a more specific schedule for individual products.
The time frame is more specific, too. An MPS is usually expressed in days or weeks and may extend over several months to cover the complete manufacture of the items contained in the MPS. The total length of time required to manufacture a product is called its cumulative lead time.
The master production schedule drives the MRP process. The schedule of finished products provided by the master schedule is needed before the MRP system can do its job of generating production schedules for component items. A sample master production schedule consisting of four end items produced by a manufacturer of specialty writing accessories.
Several comments should be made concerning the quantities contained in the MPS:
- The quantities represent production, not demand Strategy decisions made in the aggregate planning stage filter down to the master production schedule. Common strategies are chase demand, level production, and batching. Pencil cases follow a level production strategy, clipboards, and lapboards a chase demand strategy, and lap desks a batching strategy.
- The quantities may consist of a combination of customer orders and demand forecasts Some companies set a time fence, within which no more changes to the master schedule are allowed. This helps to stabilize the production environment.
The MPS for clipboards and lapboards illustrates two approaches to future scheduling. For clipboards, production beyond period 3 is based on demand forecasts of an even 100 units per period. Projecting these requirements now based on past demand data helps in planning for the availability of resources.
For lapboards, production beyond period 3 appears sparse, probably because it is based on actual customer orders received.
- The quantities represent what needs to be produced, not what can be produced Because the MPS is derived from the aggregate production plan, its requirements are probably “doable,” but until the MRP system considers the specific resource needs and the timing of those needs, the feasibility of the MPS cannot be guaranteed.
Thus, the MRP system is often used to simulate production to verify that the MPS is feasible or to confirm that a particular order can be completed by a certain date before the quote is given to the customer. - The quantities represent end items that may or may not be finished products The level of master scheduling can differ by type of production system. In make-to-stock companies, the MPS consists of finished products. In assemble-to-order companies, the MPS usually represents major subassemblies or modules. In make-to-order companies, the master schedule can consist of critical components, hard-to-get materials, and service parts. Separate final assembly schedules are then used for the finished product or customer order.
Product Structure File
Once the MPS is set, the MRP system accesses the product structure file to determine which component items need to be scheduled. The product structure file contains a bill of material (BOM) for every item produced. The bill of material for a product lists the items that go into the product, includes a brief description of each item, and specifies when and in what quantity each item is needed in the assembly process.
When each item is needed can best be described in the form of a product structure diagram, for a clipboard. An assembled item is sometimes referred to as a parent and a component as a child. The number in parentheses with each item is the quantity of a given component needed to make one parent. Thus, one clip assembly, two rivets, and one pressboard are needed to make each clipboard. The clip assembly, rivets, and board appear at the same level of the product structure because they are to be assembled.
A diagram can be converted to a computerized bill of material by labeling the levels in the product structure. The final product or end item at the top of the structure—in this case, the clipboard—is labeled level 0. The level number increases as we move down the product structure. The clipboard has three levels of assembly. The bill of material for the clipboard shows some levels indented underneath others. This specifies which components belong to which parents and can easily be matched to the product structure diagram.
| Level | Item | Unit of Measure | Quantity |
| 0- – – – | Clipboard | ea | 1 |
| – 1- – – | Clip assembly | ea | 1 |
| – – 2- – | Top clip | ea | 1 |
| – – 2- – | Bottom clip | ea | 1 |
| – – 2- – | Pivot | ea | 1 |
| – – 2- – | Spring | ea | 1 |
| – 1- – – | Rivet | ea | 2 |
| – 1- – – | Pressboard | ea | 1 |
Several specialized bills of material have been designed to simplify information requirements, clarify relationships, and reduce computer processing time. They include phantom bills, K-bills, and modular bills.
Phantom Bills These are used for transient sub-assemblies that never see a stockroom because they are immediately consumed in the next stage of manufacture. These items have a lead time of zero and a special code so that no orders for them will be released. Phantom bills are becoming more common as companies adopt lean manufacturing concepts that speed products through the manufacturing and assembly process.
K-Bills K-bills or kit numbers group small, loose parts such as fasteners, nuts, and bolts together under one pseudo-item number. In this way, requirements for the items are processed only once (for the group), rather than for each item. It reduces the paperwork, processing time, and file space required in generating orders for small, inexpensive items that are usually ordered infrequently in large quantities.
Modular Bills Modular bills of material are appropriate when the product is manufactured in major subassemblies or modules that are later assembled into the final product with customer-designated options. With this approach, the end item in the master production schedule is not a finished product, but a major option or module. This reduces the number of bills of material that need to be input, maintained, and processed by the MRP system.
Time-Phased Bills A time-phased bill of material, also known as a time-phased assembly chart, is a horizontal product structure diagram that graphically shows the lead time required to purchase or manufacture an item.
Item Master File
The item master file, or inventory file, contains an extensive amount of information on every item that is produced, ordered, or inventoried in the system. It includes such data as on-hand quantities, on-order quantities, lot sizes, safety stock, lead time, and past usage figures.
The item master file is updated whenever items are withdrawn from or added to the inventory or whenever an order is released, revised, or completed. Accuracy of inventory transactions is essential to MRP’s ability to keep inventory levels at a minimum. It is estimated that 95% inventory accuracy is a prerequisite for an effective MRP system. Although technologies such as bar codes, voice-activated systems, and automated “picking” equipment can improve inventory accuracy considerably, a general overhaul of inventory procedures is often needed.
This involves:
- maintaining orderly stockrooms;
- establishing and enforcing procedures for inventory withdrawal;
- ensuring prompt and accurate entry of inventory transactions;
- taking physical inventory count regularly; and
- reconciling inventory discrepancies promptly.
Cycle counting involves taking a physical count of at least some inventory items daily and reconciling differences as they occur. The system specifies which items are to be counted each day and may tie the frequency of the count to the frequency of orders for the item within the MRP system. Thus, items that are used more often are counted more often. It may also be related to the ABC classification system.
Items would be counted more often than B items, perhaps weekly. B items would be counted monthly, and C items may still be counted only once a year. Approved cycle counting systems are accepted by the accounting standards boards as valid replacements for end-of-year physical inventories.
MRP Process
The MRP system is responsible for scheduling the production of all items beneath the end item level. It recommends the release of work orders and purchase orders, and issues rescheduling notices when necessary. The MRP process consists of four basic steps:
- exploding the bill of material
- netting out inventory
- lot sizing, and
- time-phasing requirements.
The process is performed again and again, moving down the product structure until all items have been scheduled. An MRP matrix, as shown in Table, is completed for each item starting with level zero items. Identifying information at the top of the matrix includes the item name or number, the lowest level at which the item appears in the product structure (called low-level code or LLC), the time required to make or purchase an item (called lead time or LT), and the quantities in which an item is usually made or purchased (called lot size).
Entries in the matrix include gross requirements, scheduled receipts, projected on hand, net requirements, planned order receipts, and planned order releases. Gross requirements begin the MRP process. They are given in the master production schedule (MPS) for end items and derived from the parent for component items. Scheduled receipts are items on order that are scheduled to arrive in future periods.
Projected on hand is inventory currently on hand or projected to be on hand at the end of each period as a result of the MRP schedule. Net requirements are what needs to be produced after on-hand and on-order quantities have been taken into account. Planned order receipts represent the quantities that will be ordered and when they must be received. These quantities differ from net requirements by lot sizing rules when production or purchasing is made in predetermined batches or lots. Common lot sizing rules include ordering in minimum or multiple quantities, using an EOQ or periodic order quantity, or ordering the exact quantities needed (called lot-for-lot or L4L).
The last row of the matrix, planned order releases, determines when orders should be placed (i.e., released) so that they are received when needed. This involves offsetting or time phasing the planned order receipts by the item’s lead time. Planned order releases at one level of a product structure generate gross requirements at the next lower level. When the MRP process is complete, the planned order releases are compiled in a planned order report.
LOT Sizing in MRP Systems
Although the L4L approach is most consistent with the objectives of MRP, in some circumstances it is useful to order an amount different from what is needed. For example, minimum order quantities (Min) are typically used to take advantage of quantity discounts or to conform to vendor requirements, maximum order quantities (Max) are used for large or expensive items when space or funds are limited, and multiple order quantities (Mult) accommodate packaging restrictions (such as a set number in a box, gallon containers, bundles, or pallet loads). Several additional lot sizing techniques are available with most MRP systems. These include economic order quantity (EOQ) and periodic order quantity (POQ).
Economic Order Quantity The EOQ can be adapted for use with MRP if it is treated as a minimum order quantity. In addition, annual demand, D, is replaced with average demand per period, d, and carrying cost, Cc, is converted to a per-period amount. It is used only sparingly, usually at the finished product or raw material level, and does not perform well when demand is highly variable.
Periodic Order Quantity The periodic order quantity (POQ) was created as a variation of the EOQ more suited to variable demand. It is calculated by dividing the EOQ by the average demand. It represents the number of demand periods covered by each order. Thus, if the POQ were three, an order would be placed for three weeks’ worth of demand.
MRP Outputs
The outputs of the MRP process are planned orders from the planned order release row of the MRP matrix. It also recommends changes in previous plans or existing schedules. These action notices, or rescheduling notices, are issued for items that are no longer needed as soon as planned or for quantities that may have changed. One of the advantages of the MRP system is its ability to show the effect of change in one part of the production process on the rest of the system. It simulates the ordering, receiving, and use of raw materials, components, and assemblies into future periods and issues warnings to the MRP planner of impending stockouts or missed due dates.
The MRP system, as the name implies, ensures that material requirements are met. However, material is not the only resource necessary to produce goods—a certain amount of labor and machine hours are also required. Thus, the next step in the planning process is to verify that the MRP plan is “feasible” by checking for the availability of labor and/or machine hours. This process is called capacity requirements planning and is similar to MRP.
Capacity Requirements Planning (CRM)
Capacity requirements planning (CRP) is a computerized system that projects the load from a given material plan onto the capacity of a system and identifies underloads and overloads. It is then up to the MRP planner to level the load—and smooth out the resource requirements so that capacity constraints are not violated. This can be accomplished by shifting requirements, reducing requirements, or temporarily expanding capacity.
There are three major inputs to CRP.
- The planned order releases from the MRP process
- A routing file, which specifies which machines or workers are required to complete an order from the MRP plan, in what order the operations are to be conducted, and the length of time each operation should take
- An open orders file, which contains information on the status of jobs that have already been released but have not yet been completed
With this information, CRP can produce a load profile for each process or work center in the shop. The load profile compares released orders and planned orders with work center capacity.
Calculating Capacity
Capacity is the maximum capability to produce. It can be measured as units of output, dollars of output, hours of work, or the number of customers processed over a specified period. Capacity is affected by the mix of products and services, the choice of technology, the size of a facility, and the resources allocated.
Rated capacity is the theoretical output that could be attained if a process were operating at full speed without interruption, exceptions, or downtime. Effective capacity takes into account the efficiency with which a particular product or customer can be processed and the utilization of the scheduled hours or work. Effective capacity expressed in hours per day is calculated as:
Effective daily capacity = (no. of machines or workers) × (hours per shift) × (no. of shifts) × (utilization) × (efficiency)
Utilization refers to the percentage of available working time that a worker works or a machine runs. Scheduled maintenance, lunch breaks, and setup time are examples of activities that reduce actual working time. Efficiency refers to how well a machine or worker performs compared to a standard output level. An efficiency of 100% is considered normal performance, 125% is above normal, and 90% is below normal. Efficiency is also dependent on product mix.
Load is the standard hours of work (or equivalent units of production) assigned to a production facility. After load and capacity have been determined, a load percent can be calculated as:
Load percent = load/capacity × 100%
Centers loaded above 100% will not be able to complete the scheduled work without some adjustment in capacity or reduction in load.
Load Profiles
Load profiles are a graphical comparison of load versus capacity. As shown in Figure 8.6, the normal capacity of Department A is 40 hours per week. We can see that the machine is underloaded in periods 1, 5, and 6 and overloaded in periods 2, 3, and 4. Underloaded conditions can be leveled by:
- Acquiring more work;
- Pulling work ahead that is scheduled for later periods; or
- Reducing normal capacity.
Additional work can be acquired by transferring similar work from other machines in the same shop that is near or over capacity, by making components in-house that are normally purchased from outside suppliers, or by seeking work from outside sources. Pulling work ahead seems like a quick and easy alternative to alleviate both underloads and overloads.
However, we must remember that the MRP plan was devised based on an interrelated product structure, so the feasibility of scheduling work in an earlier period is contingent on the availability of required materials or components. In addition, work completed before its due date must be stored in inventory and thus incurs a holding cost. When work is shifted to other periods, the MRP plan should be rerun to check the feasibility of the proposed schedule.
If an underloaded condition continues for some time, reducing the size of the workforce may be necessary. Smaller underloads can be handled by reducing the length of the working day or workweek, by scheduling idled workers for training sessions or vacations, or by transferring workers to other positions at machine centers or processes where overloads are occurring.
Overloads
Overloaded conditions are the primary concern of the MRP planner because an overloaded schedule left unchecked cannot possibly be completed as planned. Overloads can be reduced by:
- Eliminating unnecessary requirements;
- Rerouting jobs to alternative machines, workers, or work centers;
- Splitting lots between two or more machines;
- Increasing normal capacity;
- Subcontracting;
- Increasing the efficiency of the operation;
- Pushing work back to later periods; or
- Revising the master schedule
Load Leveling
Ten hours of work are pulled ahead from period 2 to period 1. Ten hours of overtime are assigned in period 2. An entire 40-hour shift is added in period 3. Ten hours of work from period 4 are pushed back to period 5, and 20 hours are pushed back to period 6. This process of balancing underloads and overloads is called load leveling.
CRP identifies capacity problems, but the planner solves the problems. With experience, the task of shifting work and leveling loads is not as formidable as it appears. However, it is helpful if the initial load profile is as accurate as possible and if previous planning stages (i.e., sales and operations planning and master production scheduling) have considered capacity constraints.
Some companies formalize capacity planning at each stage of production planning. Resource requirements planning is associated with the sales and operations plan, and rough-cut capacity planning is performed before the approval of a master schedule. Capacity requirements planning may still be performed on the material requirements plan, but its role is to fine-tune existing resources rather than to find or develop new resources.
Once the feasibility of an MRP plan has been verified by CRP, the plan can be executed by releasing orders in the periods indicated. Normally, the ERP system automatically releases the orders. Work orders sent to the shop enter a shop floor control system, where daily scheduling and monitoring take place. When received, purchase orders are logged through the inventory system electronically before moving to manufacturing.
Relaxing MRP Assumptions
Today’s ERP technology allows us to relax some of the more restrictive assumptions of MRP. For example, we have learned the following:
- Material is not always the most constraining resource The iterative procedure described in the previous section for determining material availability first, then verifying capacity may not be relevant to some industries. If particular processes constrain the system or other capacity constraints that are difficult to relax, then they should drive the schedule rather than the availability of materials.
- Lead times can vary Fixed lead times assume that either lot sizes will continue unchanged or that they have no bearing on lead time.
- Not every transaction needs to be recorded MRP tries to keep track of the status of all jobs in the system and reschedules jobs as problems occur. In a manufacturing environment of speed and small lot sizes, this is cumbersome.
- The shop floor may require a more sophisticated scheduling system Dynamic scheduling environments require a level of sophistication not present in most MRP systems.
- Scheduling in advance may not be appropriate for on-demand production Many companies today produce products on-demand from customers. The just-in-time or lean production environment may produce better results under those circumstances.
Customer Relationship Management (CRM)
Perhaps no new application reinforces the changing focus of ERP better than customer relationship management. Customer relationship management (CRM) software plans and executes business processes that involve customer interaction, such as marketing, sales, fulfillment, and service. CRM changes the focus from managing products to managing customers. With the advent of e-commerce, companies can sell directly to the customer. Marketing can be personalized to individual preferences and behaviors.
A wealth of data on customer buying behavior is available from records of purchases and analysis of click-streams. Special events, such as holidays or product promotions, can trigger customer purchases. Point-of-sale data from physical stores, mail-order purchases and online purchases are monitored. All of these data go into a data warehouse, where they are analyzed for patterns (called data mining) from which predictions of future behavior are made.
Prospect information, customer profiles, sales-force automation, and campaign modules for direct mail and special sales promotions are managed with CRM. In addition to collecting and analyzing customer data, CRM provides decision support for forecasting demand, demand management, pricing products and services, quoting order delivery dates, and planning for customer service needs.
Customer service includes tracking and tracing orders, returns, repairs, service, and warranty management. CRM interacts with supply chain management (SCM) software and ERP to ensure prompt and accurate order fulfillment and to plan for future requirements.
Supply Chain Management (SCM)
Supply chain management (SCM) software includes supply chain planning, supply chain execution, and supplier relationship management. Planning involves designing the supply chain network, demand planning, and collaborative supply planning. Execution involves fulfillment, manufacturing, and delivery. Relationship management handles all the interactions with suppliers from supplier certification to quality assurance, contracts, and agreements.
From the above list, you can see that the distinction between business software applications has become increasingly blurred as ERP vendors are adding more SCM functions, and SCM vendors are encroaching on ERP. SAP, whose ERP application runs most Fortune 500 companies, is now concentrating on a suite of new offerings in supply chain management, customer relationship management, and product lifecycle management. i2 technologies, now owned by JDA, has incorporated ERP functions into its TradeMatrix software. Oracle, known for its database management systems, emphasizes CRM, B2B, and business intelligence.
Product Lifecycle Management (PLM)
A new entry into business application software is product lifecycle management (PLM). PLM manages product data through the life of the product, coordinates product and process redesign, and collaborates with suppliers and customers in the design process.
PLM, CRM, ERP, and SCM make a powerful combination. Figure 8.9 shows how these types of software systems can work together. Customer and supplier collaboration on design with PLM can reduce time to market for new products and services. Similarly, customer and supplier collaboration in manufacturing via ERP helps speed the product to the customer. Design and manufacture collaborate in the DFMA (design for manufacture and assembly) process.
Connectivity, Integration, Big Data, And the Cloud
Getting ERP, PLM, CRM, and SCM systems to talk to each other within a company is difficult. Getting them to communicate across hundreds of different companies and vendors is a daunting task. Using the same suite of products from one vendor facilitates integration, but most companies prefer a best-of-breed approach, buying the products or modules that best fit their business from a variety of vendors. It is common for e-business applications to come with application programming interfaces (APIs) that give other programs well-defined ways of speaking to them.
However, APIs that allow communication between application A and application B are overwhelmed when applications C, D, and E are added to the exchange. Enter third-party vendors that offer enterprise application integration (EAI). This software breaks down a complex business process into a series of transactions between applications. It then breaks those transactions into languages each application can understand. That language is most likely XML (for extensible markup language); newer software uses XML extensively.
Electronic data interchange (EDI) used to be the language of business-to-business communication. While EDI is good at transmitting orders and invoices, it cannot change product descriptions, transmit product drawings, update in real-time, or easily communicate with ERP systems. XML, on the other hand, was built for the Internet. Instead of downloading data from one system and reentering it into another, XML tags each chunk of data—such as part number, price, and delivery date—before sending it to a trading partner. The receiving XML-run system picks out the data by its tag and inserts it into the proper place in its ERP system. Thus, websites can communicate with websites and computers with computers.
For many companies, purchasing an ERP software package means paying too much money for features and functionality they will never use. Recent trends in software engineering, such as SOA, can provide relief. Service-oriented architecture (SOA) is a collection of “services” that communicate with each other within software or between software.
Clients can bundle together the services that they need and do not need to purchase the entire software system. These systems can be more flexible and efficient than current offerings, but they can also cost more to customize. SOA radically changes how software is designed, offered, sold, and used. Software vendors like the ability to reuse and share services across clients and business services. SOA also provides a means to deploy and quickly reconfigure applications as business conditions change.
We have seen that ERP software can be quite expensive and time-consuming to install, maintain, and operate. The decomposition of large software systems into services has prompted another revolution in the way software is delivered to customers. Many companies prefer storing their data or accessing business software, such as ERP or CRM, from the vendor’s site or a third-party host site, instead of installing, running, and maintaining it in-house. This approach, known as software as a service (SaaS), is gaining popularity in both large and small companies.
In addition to providing the software on-demand to its clients, vendors or third-party providers also maintain and run the IT infrastructure, including the networks, servers, operating systems, and storage necessary to run the software. This broader view of on-demand IT services, usually delivered by a provider over the Internet, is known as cloud computing. Salesforce was the first business software vendor to successfully use cloud computing in the CRM market, followed by NetSuite for e-commerce and financials. Most ERP vendors today offer cloud services. For example, SAP offers NetWeaver as its technology platform for SOA and Business By Design for small to mid-sized businesses who are interested in SaaS.
ERP systems are also challenged by new technologies in big data and analytics. The amount of data in the world is increasing at an unparalleled rate; 90% of the data in the world today was created in the past two years alone. These massive data streams containing both structured and unstructured data are known collectively as big data. Companies are challenged with where to store this amount of data, how to analyze it, and how to act on it.
Unstructured data (video, images, texts, emails, logs, IoT output, etc.) is not represented in a form that can be stored or processed in a relational database, the type of database used by ERP systems. Google, P&G, Ancestry.com, and many other businesses with large data sets use Hadoop, an open-source software for storing and running applications in parallel across hundreds or thousands of machine clusters. While Hadoop is the most popular platform currently used for big data, new technologies for cluster computing are in development.
There are also other approaches for big data processing, such as in-memory computing, represented by SAP’s HANA platform. How do ERP systems interact with these new technologies? As shown in Figure 8.10, transactional data and other structured data from ERP and related CRM, SCM, and PLM systems are processed through a data warehouse but can also be added to the unstructured data sent to Hadoop or HANA for analysis. Business analytics of various types are applied, decisions are made, and the results are sent back to enterprise systems for use in the next cycle. Enterprise systems continue to evolve in functionality, connectivity, and integration with new technologies.
Business Ethics
(Click on Topic to Read)
- What is Ethics?
- What is Business Ethics?
- Values, Norms, Beliefs and Standards in Business Ethics
- Indian Ethos in Management
- Ethical Issues in Marketing
- Ethical Issues in HRM
- Ethical Issues in IT
- Ethical Issues in Production and Operations Management
- Ethical Issues in Finance and Accounting
- What is Corporate Governance?
- What is Ownership Concentration?
- What is Ownership Composition?
- Types of Companies in India
- Internal Corporate Governance
- External Corporate Governance
- Corporate Governance in India
- What is Enterprise Risk Management (ERM)?
- What is Assessment of Risk?
- What is Risk Register?
- Risk Management Committee
Corporate social responsibility (CSR)
Lean Six Sigma
- Project Decomposition in Six Sigma
- Critical to Quality (CTQ) Six Sigma
- Process Mapping Six Sigma
- Flowchart and SIPOC
- Gage Repeatability and Reproducibility
- Statistical Diagram
- Lean Techniques for Optimisation Flow
- Failure Modes and Effects Analysis (FMEA)
- What is Process Audits?
- Six Sigma Implementation at Ford
- IBM Uses Six Sigma to Drive Behaviour Change
Research Methodology
Management
Operations Research
Operation Management
- What is Strategy?
- What is Operations Strategy?
- Operations Competitive Dimensions
- Operations Strategy Formulation Process
- What is Strategic Fit?
- Strategic Design Process
- Focused Operations Strategy
- Corporate Level Strategy
- Expansion Strategies
- Stability Strategies
- Retrenchment Strategies
- Competitive Advantage
- Strategic Choice and Strategic Alternatives
- What is Production Process?
- What is Process Technology?
- What is Process Improvement?
- Strategic Capacity Management
- Production and Logistics Strategy
- Taxonomy of Supply Chain Strategies
- Factors Considered in Supply Chain Planning
- Operational and Strategic Issues in Global Logistics
- Logistics Outsourcing Strategy
- What is Supply Chain Mapping?
- Supply Chain Process Restructuring
- Points of Differentiation
- Re-engineering Improvement in SCM
- What is Supply Chain Drivers?
- Supply Chain Operations Reference (SCOR) Model
- Customer Service and Cost Trade Off
- Internal and External Performance Measures
- Linking Supply Chain and Business Performance
- Netflix’s Niche Focused Strategy
- Disney and Pixar Merger
- Process Planning at Mcdonald’s
Service Operations Management
Procurement Management
- What is Procurement Management?
- Procurement Negotiation
- Types of Requisition
- RFX in Procurement
- What is Purchasing Cycle?
- Vendor Managed Inventory
- Internal Conflict During Purchasing Operation
- Spend Analysis in Procurement
- Sourcing in Procurement
- Supplier Evaluation and Selection in Procurement
- Blacklisting of Suppliers in Procurement
- Total Cost of Ownership in Procurement
- Incoterms in Procurement
- Documents Used in International Procurement
- Transportation and Logistics Strategy
- What is Capital Equipment?
- Procurement Process of Capital Equipment
- Acquisition of Technology in Procurement
- What is E-Procurement?
- E-marketplace and Online Catalogues
- Fixed Price and Cost Reimbursement Contracts
- Contract Cancellation in Procurement
- Ethics in Procurement
- Legal Aspects of Procurement
- Global Sourcing in Procurement
- Intermediaries and Countertrade in Procurement
Strategic Management
- What is Strategic Management?
- What is Value Chain Analysis?
- Mission Statement
- Business Level Strategy
- What is SWOT Analysis?
- What is Competitive Advantage?
- What is Vision?
- What is Ansoff Matrix?
- Prahalad and Gary Hammel
- Strategic Management In Global Environment
- Competitor Analysis Framework
- Competitive Rivalry Analysis
- Competitive Dynamics
- What is Competitive Rivalry?
- Five Competitive Forces That Shape Strategy
- What is PESTLE Analysis?
- Fragmentation and Consolidation Of Industries
- What is Technology Life Cycle?
- What is Diversification Strategy?
- What is Corporate Restructuring Strategy?
- Resources and Capabilities of Organization
- Role of Leaders In Functional-Level Strategic Management
- Functional Structure In Functional Level Strategy Formulation
- Information And Control System
- What is Strategy Gap Analysis?
- Issues In Strategy Implementation
- Matrix Organizational Structure
- What is Strategic Management Process?
Supply Chain


