
What is Capacity Planning?
Capacity planning in supply chain management refers to the process of determining the production capacity needed by an organization to meet changing demands for its products or services. It involves evaluating current capacity, forecasting future demand, and making decisions to ensure that the organization has the right resources in place to meet those demands efficiently.
Table of Content
Capacity is the maximum capability to produce. Capacity planning takes place at several levels of detail. Long-term capacity planning is a strategic decision that establishes a firm’s overall level of resources. It extends over a time horizon long enough to obtain those resources—usually a year or more for building or expanding facilities or acquiring new businesses.
Capacity decisions affect product lead times, customer responsiveness, operating costs, and a firm’s ability to compete. Inadequate capacity can lose customers and limit growth.
Excess capacity can drain a company’s resources and prevent investments in more lucrative ventures. When to increase capacity and how much to increase it are critical decisions. Three basic strategies for the timing of capacity expansion about a steady growth in demand.
Capacity Expansion Strategies
- Capacity lead strategy: Capacity is expanded in anticipation of demand growth. This aggressive strategy is used to lure customers from competitors who are capacity-constrained or to gain a foothold in a rapidly expanding market. It also allows companies to respond to unexpected surges in demand and to provide superior levels of service during peak demand periods.
- Average capacity strategy: Capacity is expanded to coincide with average expected demand. This is a moderate strategy in which managers are certain they will be able to sell at least some portion of the expanded output and endure some periods of unmet demand. Approximately half of the time capacity leads to demand, and half of the time capacity lags demand.
- Capacity lag strategy: Capacity is increased after an increase in demand has been documented.
This conservative strategy produces a higher return on investment but may lose customers in the process. It is used in industries with standard products and cost-based or weak competition. The strategy assumes that lost customers will return from competitors after capacity has expanded.
Consider higher education’s strategy in preparing for a tripling of the state’s college-bound population in the next decade. An established university, guaranteed applicants even in lean years, may follow a capacity lag strategy. A young university might lead to capacity expansion in hopes of capturing students not admitted to the more established universities.
A community college may choose the average capacity strategy to fulfill its mission of educating the state’s youth but with little risk.
How much to increase capacity depends on
- the volume and certainty of anticipated demand;
- strategic objectives in terms of growth, customer service, and competition; and
- the costs of expansion and operation.
Capacity can be increased incrementally or in one large step. Incremental expansion is less risky but more costly. An attractive alternative to expanding capacity is outsourcing, in which suppliers absorb the risk of demand uncertainty.
The best operating level for a facility is the percent of capacity utilization that minimizes average unit cost. Rarely is the best operating level at 100% of capacity—at higher levels of utilization, productivity slows and things start to go wrong. Average capacity utilization differs by industry. An industry with an 80% average utilization would have a 20% capacity cushion for unexpected surges in demand or temporary work stoppages.
Large-capacity cushions are common in industries in which demand is highly variable, resource flexibility is low, and customer service is important. Utilities, for example, maintain a 20% capacity cushion. Capital-intensive industries with less flexibility and higher costs maintain cushions under 10%. Airlines maintain a negative cushion by overbooking flights. The best operating level can also refer to the most economic size of a facility.
Economies of scale occur when it costs less per unit to produce or operate at high levels of output. This holds when:
- Fixed costs can be spread over a larger number of units,
- Production or operating costs do not increase linearly with output levels,
- Quantity discounts are available for material purchases, and
- Operating efficiency increases as workers gain experience.
The electronics industry provides a good case example of economies of scale. The average cost per chip placement for printed circuit board assembly is 32 cents in factories with a volume of 25 million placements, 15 cents in factories with 200 million placements, and only 10 cents in factories with 800 million placements. Capacity decisions provide a framework for further facility decisions, such as where to locate a new facility and how to arrange the flow of work in the facility.
Facilities in Supply Chain
Facilities make a difference. They can provide a competitive edge by enabling and leveraging the latest process concepts. Green buildings can save energy costs and increase worker productivity. Facility design has an impact on both quality and productivity.
Facilities affect how efficiently workers can do their jobs, how much and how fast goods can be produced, how difficult it is to automate a system, and how responsive the system can be to changes in product or service design, product mix, or demand volume. Facilities must be planned, located, and laid out.
Facility layouts are more flexible than ever before. Factories that once positioned shipping and receiving departments at one end of the building now construct T-shaped buildings so that deliveries can be made directly to points of use within the factory.
Stores sport portable kiosks for customer inquiry and checkout at various locations throughout the facility. Classrooms incorporate desks on wheels to be repositioned for different teaching styles and student interaction. Effective layouts can have many different objectives.
Objectives of Facility Layout
Facility layout refers to the arrangement of activities, processes, departments, workstations, storage areas, aisles, and common areas within an existing or proposed facility. The basic objective of the layout decision is to ensure a smooth flow of work, material, people, and information through the system. Effective layouts also do the following:
- Minimize movement and material handling costs
- Utilize space efficiently
- Utilize labor
- Eliminate bottlenecks
- Facilitate communication and interaction between workers, between workers and their supervisors, and between workers and customers
- Reduce manufacturing cycle time and customer service time
- Eliminate wasted or redundant movement
- Facilitate the entry, exit, and placement of material, products, and people
- Incorporate safety and security measures
- Promote product and service quality
- Encourage proper maintenance activities
- Provide a visual control of activities
- Provide flexibility to adapt to changing conditions
- Increase capacity
Designing Process Layouts
In designing a process layout, we want to minimize movement or material-handling cost, which is a function of the amount of material moved times the distance it is moved. This implies that departments that incur the most interdepartmental movement should be located closest to each other, and those that do not interact should be located farther away. Two techniques used to design process layouts, block diagramming, and relationship diagramming, are based on logic and the visual representation of data.
Block Diagramming
We begin with data on the historical or predicted movement of material between departments in the existing or proposed facility. This information is typically provided in the form of a from/to chart, or load summary chart. The chart gives the average number of unit loads transported between the departments over a given period. A unit load can be a single unit, a pallet of material, a bin of material, or a crate of material—however, the material is normally moved from location to location. In automobile manufacturing, a single car represents a unit load.
For a ball-bearing producer, a unit load might consist of a bin of 100 or 1000 ball bearings, depending on their size. The next step in designing the layout is to calculate the composite movements between departments and rank them from most movement to least movement. Composite movement, represented by a two-headed arrow, refers to the back-and-forth movement between each pair of departments.
Finally, trial layouts are placed on a grid that graphically represents the relative distances between departments in the form of uniform blocks. The objective is to assign each department to a block on the grid so that nonadjacent loads are minimized. The term nonadjacent is defined as a distance farther than the next block, either horizontally, vertically, or diagonally. The trial layouts are scored based on the number of nonadjacent loads.
Ideally, the optimal layout would have zero nonadjacent loads. In practice, this is rarely possible, and the process of trying different layout configurations to reduce the number of nonadjacent loads continues until an acceptable layout is found.
Relationship Diagramming
The preceding solution procedure is appropriate for designing process layouts when quantitative data are available. However, in situations for which quantitative data are difficult to obtain or do not adequately address the layout problem, the load summary chart can be replaced with subjective input from analysts or managers.
Richard Muther developed a format for displaying manager preferences for departmental locations, known as Muther’s grid. The preference information is coded into six categories associated with the five vowels, A, E, I, O, and U, plus the letter X.
Designing Service Layouts
Most service organizations use process layouts. This makes sense because of the variability in customer requests for service. Service layouts are designed in much the same way as process layouts in manufacturing firms, but the objectives may differ.
For example, instead of minimizing the flow of materials through the system, services may seek to minimize the flow of paperwork or to maximize customer exposure to as many goods as possible. Grocery stores take this approach when they locate milk on one end of the store and bread on the other, forcing the customer to travel through aisles of merchandise that might prompt additional purchases.
In addition to the location of departments, service layouts are concerned with the circulation of customer traffic through the facility. There are a variety of ways to prompt the flow of customers through various processes or departments.
Different types of layouts are shown. Freeflow layouts encourage browsing, increase impulse purchasing, and are flexible and visually appealing. Grid layouts encourage customer familiarity, are low cost, easy to clean and secure, and are good for repeat customers. Loop layouts and spine layouts fall between the extremes of free flow and grids. They both increase customer sightlines and exposure to products while encouraging the customer to circulate through the entire store.
Service layouts are also concerned with the allocation of space to departments, the location of special displays, the efficiency of checkout procedures, and protection from pilferage. Space allocation is determined by evaluating the sales per square foot of a product or product line versus the willingness of a vendor to pay for product placement. Industry-specific recommendations are available for layout and display decisions.
Computerized applications, such as SLIM (Store Labor and Inventory Management) and COSMOS (Computerized Optimization and Simulation Modeling for Operating Supermarkets), consider shelf space, demand rates, profitability, and stockout probabilities in layout design. Finally, services may have both a back office (invisible to the customer) and a front office (in full view of the customer) component.
Back offices may be organized for employee efficiency, functionality, or well-being, while front office layouts must be aesthetically pleasing to the customer as well as functional. For that reason, service layouts are often considered part of the service design process.
Designing Product Layouts
A product layout arranges machines or workers in a line according to the operations that need to be performed to assemble a particular product. From this description, it would seem the layout could be determined simply by following the order of assembly as contained in the bill of material for the product. To some extent, this is true. Precedence requirements, specifying which operations must precede others, which can be done concurrently, and which must wait until later, are an important input to the product layout decision. But other factors make the decision more complicated.
Product layouts or assembly lines are used for high-volume production. To attain the required output rate as efficiently as possible, jobs are broken down into their smallest indivisible portions, called work elements. Work elements are so small that they cannot be performed by more than one worker or at more than one workstation.
However it is common for one worker to perform several work elements as the product passes through his or her workstation. Part of the layout decision is concerned with grouping these work elements into workstations so products flow through the assembly line smoothly.
A workstation is any area along the assembly line that requires at least one worker or one machine. If each workstation on the assembly line takes the same amount of time to perform the work elements that have been assigned, then products will move successively from workstation to workstation with no need for a product to wait or a worker to be idle. The process of equalizing the amount of work at each workstation is called line balancing.
Line Balancing
Assembly-line balancing operates under two constraints: precedence requirements and cycle time restrictions.
Precedence requirements are physical restrictions on the order in which operations are performed on the assembly line. For example, we would not ask a worker to package a product before all the components were attached, even if he or she had the time to do so before passing the product to the next worker on the line.
To facilitate line balancing, precedence requirements are often expressed in the form of a precedence diagram. The precedence diagram is a network, with work elements represented by circles or nodes and precedence relationships represented by directed line segments connecting the nodes.
Cycle time, the other restriction of online balancing refers to the maximum amount of time the product is allowed to spend at each workstation if the targeted production rate is to be reached. The desired cycle time is calculated by dividing the time available for production by the number of units scheduled to be produced:
Cd = production time available / desired units of output
Suppose a company wanted to produce 120 units in an 8-hour day. The cycle time necessary to achieve the production quota is:
Cd= 80hrs x 60min/hr / 120 unit
= 4min
Line balancing is a trial-and-error process. We group elements into workstations recognizing time and precedence constraints. For simple problems, we can evaluate all feasible groupings of elements. For more complicated problems, we need to know when to stop trying different workstation configurations.
The efficiency of the line can provide one type of guideline; the theoretical minimum number of workstations provides another. The formulas for efficiency, E, and minimum number of workstations, N, are
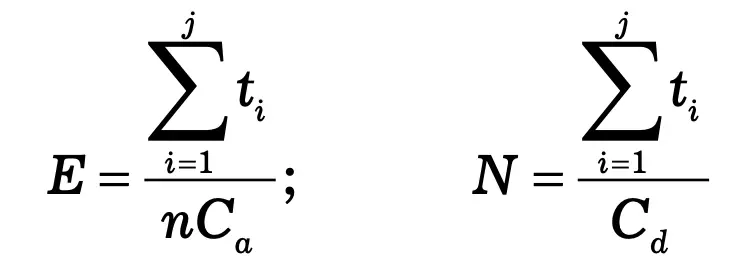
where
- t i = completion time for element i
- j = number of work elements
- n = actual number of work stations
- Ca = actual cycle time
- Cd = desired cycle time
The total idle time of the line, called balance delay, is calculated as (1 ¶ efficiency). Efficiency and balance delay are usually expressed as percentages. In practice, it may be difficult to attain the theoretical number of workstations or 100% efficiency.
The line-balancing process can be summarized as follows:
- Draw and label a precedence diagram.
- Calculate the desired cycle time required for the line.
- Calculate the theoretical minimum number of workstations.
- Group elements into workstations, recognizing cycle time and precedence constraints.
- Calculate the efficiency of the line.
- Determine if the theoretical minimum number of workstations or an acceptable efficiency level has been reached. If not, go back to step 4.
Computerized Line Balancing
Line balancing by hand becomes unwieldy as the problems grow in size. Fortunately, there are software packages that will balance large lines quickly. IBM’s COMSOAL (Computer Method for Sequencing Operations for Assembly Lines) and GE’s ASYBL (Assembly Line Configuration Program) can assign hundreds of work elements to workstations on an assembly line. These programs, and most that are commercially available, do not guarantee optimal solutions. They use various heuristics, or rules, to balance the line at an acceptable level of efficiency.
Five common heuristics are: longest operation time, shortest operation time, most number of following tasks, least number of following tasks, and ranked positional weight. Positional weights are calculated by summing the processing times of those tasks that follow an element. These heuristics specify the order in which work elements are considered for allocation to workstations. Elements are assigned to workstations in the order given until the cycle time is reached or until all tasks have been assigned. The most number of following tasks heuristic.
Hybrid Layouts
Hybrid layouts modify and/or combine some aspects of product and process layouts. We discuss three hybrid layouts: cellular layouts, flexible manufacturing systems, and mixed-model assembly lines.
Cellular Layouts
Cellular layouts attempt to combine the flexibility of a process layout with the efficiency of a product layout. Based on the concept of group technology (GT), dissimilar machines or activities are grouped into work centers, called cells, to process families of parts or customers with similar requirements. The cells are arranged about each other so that material movement is minimized. Large machines that cannot be split among cells are located near to the cells that use them, that is, at their point of use.
The layout of machines within each cell resembles a small assembly line. Thus, line-balancing procedures, with some adjustment, can be used to arrange the machines within the cell. The layout between cells is a process layout. Therefore, computer programs such as CRAFT can be used to locate cells and any leftover equipment in the facility.
Production flow analysis (PFA) is a group technology technique that reorders part routing matrices to identify families of parts with similar processing requirements. The reordering process can be as simple as using the “Data Sort” command in Excel for the most common machines, or as sophisticated as pattern-recognition algorithms from the field of artificial intelligence.
Advantages of Cellular Layouts Cellular layouts have become popular in the past decade as the backbone of modern factories. Cells can differ considerably in size, in automation, and the variety of parts processed. As small, interconnected layout units, cells are common in services, as well as manufacturing.
Advantages of Cellular Layouts
- Reduced material handling and transit time Material movement is more direct. Less distance is traveled between operations. The material does not accumulate or wait long periods to be moved. Within a cell, the worker is more likely to carry a partially finished item from machine to machine than wait for material-handling equipment, as is characteristic of process layouts where larger loads must be moved farther distances.
- Reduced setup time Since similar parts are processed together, the adjustments required to set up a machine should not be that different from item to item. If it does not take that long to change over from one item to another, then the changeover can occur more frequently, and items can be produced and transferred in very small batches or lot sizes.
- Reduced work-in-process inventory In a work cell, as with assembly lines, the flow of work is balanced so that no bottleneck or significant build-up of material occurs between stations or machines. Less space is required for storage of in-process inventory between machines, and machines can be moved closer together, thereby saving transit time and increasing communication.
- Better use of human resources Typically, a cell contains a small number of workers responsible for producing a completed part or product. The workers act as a self-managed team, in most cases more satisfied with the work that they do and more particular about the quality of their work. Labor in cellular manufacturing is a flexible resource. Workers in each cell are multifunctional and can be assigned to different routes within a cell or between cells as demand volume changes.
- Easier to control Items in the same part family are processed similarly through the work cell. There is a significant reduction in the paperwork necessary to document material travel, such as where an item should be routed next, if the right operation has been performed, and the current status of a job. With fewer jobs processed through a cell, smaller batch sizes, and less distance to travel between operations, the progress of a job can be verified visually.
- Easier to automate Automation is expensive. Rarely can a company afford to automate an entire factory all at once. Cellular layouts can be automated one cell at a time.
Disadvantages of Cellular Layouts
Despite their many advantages, cellular layouts are not appropriate for all types of businesses. The following disadvantages of cellular layouts must be considered:
- Inadequate part families, There must be enough similarity in the types of items processed to form distinct part families. Cellular manufacturing is appropriate for medium levels of product variety and volume. The formation of part families and the allocation of machines to cells are not always easy tasks. Part families identified for design purposes may not be appropriate for manufacturing purposes.
- Poorly balanced cells Balancing the flow of work through a cell is more difficult than assembly-line balancing because items may follow different sequences through the cell that require different machines or processing times. The sequence in which parts are processed can thus affect the length of time a worker spends at a certain stage of processing and thus delay his arrival to a subsequent stage in his worker path.
Poorly balanced cells can be very inefficient. It is also important to balance the workload among cells in the system so that one cell is not overloaded while others are idle. This may be taken care of in the initial cellular layout, only to become a problem as changes occur in product designs or product mix. Severe imbalances may require the reformation of cells around different part families, and the cost and disruption that implies. - Expanded training and scheduling of workers Training workers to do different tasks is expensive and time-consuming and requires worker cooperation. Some tasks are too different for certain workers to master. Although flexibility in worker assignment is one of the advantages of cellular layouts, the task of determining and adjusting worker paths within or between cells can be quite complex.
- Increased capital investment In cellular manufacturing, multiple smaller machines are preferable to single large machines. Implementing a cellular layout can be economical if new machines are being purchased for a new facility, but it can be quite expensive and disruptive in existing production facilities where new layouts are required. Existing equipment may be too large to fit into cells or may be underutilized when placed in a single cell. Additional machines of the same type may have to be purchased for different cells. The cost and downtime required to move machines can also be high.
Flexible Manufacturing Systems
A flexible manufacturing system (FMS) consists of numerous programmable machine tools connected by an automated material handling system and controlled by a common computer network. It is different from traditional automation, which is fixed or “hardwired” for a specific task. Fixed automation is very efficient and can produce very high volumes, but is not flexible. Only one type or model of product can be produced on most automated production lines, and a change in product design would require extensive changes in the line and its equipment.
An FMS combines flexibility with efficiency. Tools change automatically from large storage carousels at each machine, which hold hundreds of tools. The material-handling system (usually conveyors or automated guided vehicles) carries workpieces on pallets, which can be locked into a machine for processing. Pallets are transferred between the conveyor and the machine automatically.
Computer software keeps track of the routing and processing requirements for each pallet. Pallets communicate with the computer controller by way of bar codes or radio signals. Parts can be transferred between any two machines in any routing sequence.
With a variety of programmable machine tools and large tool banks, an FMS can theoretically produce thousands of different items as efficiently as a thousand of the same items. The efficiency of an FMS is derived from reductions in setup and queue times. Setup activities take place before the part reaches the machine.
A machine is presented only with parts and tools ready for immediate processing. Queuing areas at each machine hold pallets ready to move at the moment the machine finishes with the previous piece. The pallet also serves as a work platform, so no time is lost transferring the workpiece from pallet to machine or positioning and fixturing the part.
Traditional assembly lines, designed to process a single model or type of product, can be used to process more than one type of product but not efficiently. Models of the same type are produced in long production runs, sometimes lasting for months, and then the line is shut down and changed over for the next model. The next model is also run for an extended time, producing perhaps half a year to a year’s supply; then the line is shut down again and changed over for yet another model; and so on.
The problem with this arrangement is the difficulty in responding to changes in customer demand. If a certain model is selling well and customers want more of it, they have to wait until the next batch of that model is scheduled to be produced. On the other hand, if demand is disappointing for models that have already been produced, the manufacturer is stuck with unwanted inventory.
Recognizing that this mismatch of production and demand is a problem, some manufacturers concentrated on devising more sophisticated forecasting techniques. Others changed how the assembly line was laid out and operated so that it became a mixed-model assembly line. First, they reduced the time needed to change over the line to produce different models. Then they trained their workers to perform a variety of tasks and allowed them to work at more than one workstation on the line, as needed. Finally, they changed how the line was arranged and scheduled.
The following factors are important in the design and operation of mixed-model assembly lines:
- Line balancing: In a mixed-model line, the time to complete a task can vary from model to model. Instead of using the completion times from one model to balance the line, a distribution of possible completion times from the array of models must be considered. In most cases, the expected value, or average, times are used in the balancing procedure. Otherwise, mixed-model lines are balanced in much the same way as single-model lines.
- U-shaped lines: To compensate for the different work requirements of assembling different models, it is necessary to have a flexible workforce and to arrange the line so that workers can assist one another as needed.
- Flexible workforce: Although worker paths are predetermined to fit within a set cycle time, the use of average time values in mixed-model lines will produce variations in worker performance. Hence, the flexibility of workers helping other workers makes a tremendous difference in the ability of the line to adapt to the varied length of tasks inherent in a mixed-model line.
- Model sequencing: Since different models are produced on the same line, mixed model scheduling involves an additional decision—the order, or sequence, of models to be run through the line. From a logical standpoint, it would be unwise to sequence two models back-to-back that require extra-long processing times.
It would make more sense to mix the assembling of models so that a short model (requiring less than the average time) followed a long one (requiring more than the average time). With this pattern, workers could “catch up” from one model to the next.
Location Planning
The physical location of business facilities can have a significant impact on the success of a company. In this section, we will briefly discuss some of the factors that are important in locating facilities. We will focus on several quantitative methods for facility location, including location factor ratings, the centre-of-gravity technique, and the load-distance technique.
Types of Facilities
The type of facility is a major determinant of its location. The factors important in determining the location of a manufacturing plant are usually different from those important in locating a service facility or a warehouse.
Heavy manufacturing facilities are large plants, require a lot of space, and are expensive to construct, such as automobile plants, steel mills, and oil refineries. Factors in the location decision for plants include construction costs, land costs, modes of transportation for shipping heavy manufactured items and receiving bulk shipments of raw materials, proximity to raw materials, utilities, means of waste disposal, and labor availability.
Sites for manufacturing plants are normally selected where construction and land costs can be kept at a minimum and raw material sources are nearby to reduce transportation costs. Access to railroads is frequently a factor in locating a plant. Environmental issues have increasingly become a factor in plant location decisions.
Light-industry facilities are perceived as cleaner plants that produce electronic equipment and components, computer products, or assembled products like TVs; breweries; or pharmaceutical firms. Retail and service facilities are usually the smallest and least costly.
Examples include retail facilities such as groceries and department stores, among many others, and such service facilities as restaurants, banks, hotels, cleaners, clinics, and law offices. However, there are always exceptions, and some service facilities, such as a hospital, a company headquarters, a resort hotel, or a university academic building, can be large and expensive.
One of the most important factors for locating a service or retail facility is proximity to customers. It is often critical that a service facility be near the customers it serves, and a retail facility must be near the customers who buy from it. Construction costs tend to be less important, although land or leasing costs can be high.
For retail operations, site costs can be very high. Factors like zoning, utilities, transportation, environmental constraints, and labor tend to be less important for service operations, and closeness to suppliers is not usually as important as it is to manufacturing firms, which must be close to materials and parts suppliers.
Site Selection: Where to Locate
Location decisions for services tend to be an important part of the overall market strategy for the delivery of their products or services to customers. Location decisions are usually made more frequently for service operations than manufacturing facilities. Facilities for service-related businesses tend to be smaller and less costly, although a hospital or hotel can require a huge investment and be very large.
Services depend on a certain degree of market saturation; the location is part of their product. Where to locate a manufacturing facility is also important, but for different reasons, not the least of which is the very high expense of building a plant or factory.
Although the primary location criterion for a service-related business is usually access to customers, a different set of criteria is important for a manufacturing facility. These include the nature of the labor force and labor costs, proximity to suppliers and markets, distribution and transportation costs, energy availability and cost, the community infrastructure of roads, sewers, and utilities, quality of life in a community, and government regulations and taxes.
Some of the factors that multinational firms must consider when locating in a foreign country include the following:
- Government stability
- Raw material availability
- Government regulations
- Number and proximity of suppliers
- Political and economic systems
- Transportation and distribution systems
- Economic stability and growth
- Labor force cost and education
- Exchange rates
- Available technology
- Culture
- Commercial travel
- Climate
- Technical expertise
- Export and import regulations, duties,
- Cross-border trade regulations and tariffs
- Group trade agreements
Factors that are considered when selecting the part of the country and community for a facility are as follows:
- Labor (availability, education, cost, and unions)
- Business climate
- Community services
- Proximity of customers
- Incentive packages
- Number of customers
- Government regulations
- Construction/leasing costs
- Environmental regulations
- Land cost
- Raw material availability
- Modes and quality of transportation
- Commercial travel
- Transportation costs
- Climate
- Community government
- Infrastructure (e.g., roads, water, sewers)
- Local business regulations
- Quality of life
- Government services
- Taxes
- Availability of sites
- Financial services
- Proximity of suppliers
- Community inducements
- Education system
Location Incentives
Besides physical and societal characteristics, local incentives have increasingly become a major important factor in attracting companies to specific locations. Incentive packages typically include job tax credits, relaxed government regulations, job training, road and sewage infrastructure improvements, and sometimes just plain cash. These incentives plus the advantages of a superior location can significantly reduce a company’s supply chain costs while helping it achieve its strategic goal for customer service.
States and communities cannot afford to overlook incentives if they hope to attract new companies and jobs. However, they must make sure that the amount of their investment in incentive packages and the costs they incur for infrastructure improvements are balanced against the number of new jobs developed and the expansion of the economy the new plant will provide. Incentives are a good public investment unless they bankrupt the locality.
While some small communities are successful in attracting new businesses, they are left with little remaining tax base to pay for the infrastructure improvements needed to support the increased population drawn by job demand. Thus, states and communities, much like businesses, need a strategy for economic development that weighs the costs versus the benefits of attracting companies.
Geographic Information Systems
One tool that is used in the facility-location and site-selection process is a geographic information system or GIS. A GIS is a computerized system for storing, managing, creating, analyzing, integrating, and digitally displaying geographic (i.e., spatial) data. A GIS is both a database system and a set of operations for working with and analyzing this data.
As a tool specifically used for site selection, it allows the user to interactively search and analyze the type of data and information (i.e., location factors) we discussed in the previous sections that might be related to the site selection process, such as population, labor, income, infrastructure, customer base, climate, taxes, and transportation. A GIS used for site selection will incorporate quantitative models and statistical analysis to help analyze the data.
The advantage of a GIS is that it enables the user to integrate large quantities of information about potential facility sites and then analyze these data with several different, powerful analytical tools. The ability to consider hundreds of separate layers of spatial information and then combine it with other layers of information is the main reason GIS has become such a popular tool for location analysis and site selection.
GIS has come to be used extensively for utilities and infrastructure planning and management, including such things as energy use, cable and pipe networks, gas lines, electrical usage and networks, and transportation, as well as real estate analysis, demographic and marketing analysis, and various government applications such as emergency services and analyzing tax bases.
GIS is also used in business applications. For example, GIS has been used to select distribution centers or hubs based on spatial data for shipping times, customer locations, and transportation routes.
Location Analysis Techniques
We will discuss three techniques to help make a location decision—the location rating factor, the centre-of-gravity technique, and the load-distance technique. The location factor rating mathematically evaluates location factors, such as those identified in the previous section. The centre-of-gravity and load-distance techniques are quantitative models that centrally locate a proposed facility among existing facilities.
Location Factor Rating
The decision of where to locate is based on many different types of information and inputs. There is no single model or technique that will select the “best” site from a group. However, techniques are available that help to organize site information and that can be used as a starting point for comparing different locations. In the location factor rating system, factors that are important in the location decision are identified. Each factor is weighted from 0 to 1.00 to prioritize the factor and reflect its importance.
A subjective score is assigned (usually between 0 and 100) to each factor based on its attractiveness compared with other locations, and the weighted scores are summed. Decisions typically will not be made based solely on these ratings, but they provide a good way to organize and rank factors.
Center-of-gravity Technique
In general, transportation costs are a function of distance, weight, and time. The center-of-gravity or weight-center technique is a quantitative method for locating a facility such as a warehouse at the center of movement in a geographic area based on weight and distance. This method identifies a set of coordinates designating a central location on a map relative to all other locations.
Load-distance Technique
A variation of the center-of-gravity method for determining the coordinates of a facility location is the load-distance technique. In this method, a single set of location coordinates is not identified. Instead, various locations are evaluated using a load-distance value that is a measure of weight and distance. For a single potential location, a load-distance value is computed as follows:
The distance di in this formula can be the travel distance if that value is known or can be determined from a map. It can also be computed using the following formula for the straight-line distance between two points, which is also the hypotenuse of a right triangle:
The load-distance technique is applied by computing a load-distance value for each potential facility location. The implication is that the location with the lowest value would result in the minimum transportation cost and thus would be preferable.
Business Ethics
(Click on Topic to Read)
- What is Ethics?
- What is Business Ethics?
- Values, Norms, Beliefs and Standards in Business Ethics
- Indian Ethos in Management
- Ethical Issues in Marketing
- Ethical Issues in HRM
- Ethical Issues in IT
- Ethical Issues in Production and Operations Management
- Ethical Issues in Finance and Accounting
- What is Corporate Governance?
- What is Ownership Concentration?
- What is Ownership Composition?
- Types of Companies in India
- Internal Corporate Governance
- External Corporate Governance
- Corporate Governance in India
- What is Enterprise Risk Management (ERM)?
- What is Assessment of Risk?
- What is Risk Register?
- Risk Management Committee
Corporate social responsibility (CSR)
Lean Six Sigma
- Project Decomposition in Six Sigma
- Critical to Quality (CTQ) Six Sigma
- Process Mapping Six Sigma
- Flowchart and SIPOC
- Gage Repeatability and Reproducibility
- Statistical Diagram
- Lean Techniques for Optimisation Flow
- Failure Modes and Effects Analysis (FMEA)
- What is Process Audits?
- Six Sigma Implementation at Ford
- IBM Uses Six Sigma to Drive Behaviour Change
Research Methodology
Management
Operations Research
Operation Management
- What is Strategy?
- What is Operations Strategy?
- Operations Competitive Dimensions
- Operations Strategy Formulation Process
- What is Strategic Fit?
- Strategic Design Process
- Focused Operations Strategy
- Corporate Level Strategy
- Expansion Strategies
- Stability Strategies
- Retrenchment Strategies
- Competitive Advantage
- Strategic Choice and Strategic Alternatives
- What is Production Process?
- What is Process Technology?
- What is Process Improvement?
- Strategic Capacity Management
- Production and Logistics Strategy
- Taxonomy of Supply Chain Strategies
- Factors Considered in Supply Chain Planning
- Operational and Strategic Issues in Global Logistics
- Logistics Outsourcing Strategy
- What is Supply Chain Mapping?
- Supply Chain Process Restructuring
- Points of Differentiation
- Re-engineering Improvement in SCM
- What is Supply Chain Drivers?
- Supply Chain Operations Reference (SCOR) Model
- Customer Service and Cost Trade Off
- Internal and External Performance Measures
- Linking Supply Chain and Business Performance
- Netflix’s Niche Focused Strategy
- Disney and Pixar Merger
- Process Planning at Mcdonald’s
Service Operations Management
Procurement Management
- What is Procurement Management?
- Procurement Negotiation
- Types of Requisition
- RFX in Procurement
- What is Purchasing Cycle?
- Vendor Managed Inventory
- Internal Conflict During Purchasing Operation
- Spend Analysis in Procurement
- Sourcing in Procurement
- Supplier Evaluation and Selection in Procurement
- Blacklisting of Suppliers in Procurement
- Total Cost of Ownership in Procurement
- Incoterms in Procurement
- Documents Used in International Procurement
- Transportation and Logistics Strategy
- What is Capital Equipment?
- Procurement Process of Capital Equipment
- Acquisition of Technology in Procurement
- What is E-Procurement?
- E-marketplace and Online Catalogues
- Fixed Price and Cost Reimbursement Contracts
- Contract Cancellation in Procurement
- Ethics in Procurement
- Legal Aspects of Procurement
- Global Sourcing in Procurement
- Intermediaries and Countertrade in Procurement
Strategic Management
- What is Strategic Management?
- What is Value Chain Analysis?
- Mission Statement
- Business Level Strategy
- What is SWOT Analysis?
- What is Competitive Advantage?
- What is Vision?
- What is Ansoff Matrix?
- Prahalad and Gary Hammel
- Strategic Management In Global Environment
- Competitor Analysis Framework
- Competitive Rivalry Analysis
- Competitive Dynamics
- What is Competitive Rivalry?
- Five Competitive Forces That Shape Strategy
- What is PESTLE Analysis?
- Fragmentation and Consolidation Of Industries
- What is Technology Life Cycle?
- What is Diversification Strategy?
- What is Corporate Restructuring Strategy?
- Resources and Capabilities of Organization
- Role of Leaders In Functional-Level Strategic Management
- Functional Structure In Functional Level Strategy Formulation
- Information And Control System
- What is Strategy Gap Analysis?
- Issues In Strategy Implementation
- Matrix Organizational Structure
- What is Strategic Management Process?
Supply Chain


