
After the amendment of the Basel Accord of 1996, financial authorities have specified that all banks should maintain reserves. These reserves should be capital that is sufficient to protect against financial and market risks. Every bank should be capable of assessing the risks it is exposed to on a regular basis. While bank regulators impose no specific risk assessment models, treasury managers in banks must have reliable methods to measure the possible risks. The market and financial risk assessment methods of banks need to satisfy the bank regulator’s monitoring statutory specifications.
Furthermore, in today’s highly competitive business environment, banks that regularly measure the risks they are exposed to gain a competitive edge over others. However, it depends on the kind of risk measurement models that the banks use. There are several market risk measurement methods that the banks depend on.
Some of these are highly technical and quantitative, while others are more subjective and have a qualitative approach. It is important for banks and other financial institutions to identify the risks, and measure them using a suitable and simple method.
Table of Content
There are several points of difference in the external and internal views about a good risk measurement method. Internally, bank treasurers need a method that ensures prompt and efficient management of the bank’s risk position.
Bank regulators, on the other hand, need to ensure that the bank’s potential for catastrophic net worth loss is accurately estimated, and the bank is capable of overcoming the losses. However, both bank treasurers and regulators need a risk measurement method that is up-to-date and meets the basic need of risk management.
Risk Measurement Methods
The Most Commonly Used Modern Risk Measurement Methods are:
Value at Risk (VAR)
Risk measurement methods are mostly based on historical performance. Value at Risk (VaR) estimates risk based on historical data ranging between 2 and 100 years. VaR refers to the estimate of the probability and magnitude of a potential loss to be expected over a future period. In other words, it is a statistical technique that measures the financial risk that a bank might be exposed to in a given time period. VaR is used by treasury risk managers to measure and reduce the risk faced by banks and financial institutes. VaR is now a standard tool in risk management.
However, the method of VaR poses a computational challenge. In order to measure market risk in a portfolio using VaR, the probability distribution of the portfolio’s market value needs to be determined. The more complex a portfolio is, the more asset categories and sources of market risk it is exposed to, making the computation of risk more difficult.
VaR measure is an algorithm that banks use to measure a portfolio’s value exposed to risks. A value-at-risk metric is specified by using the following three elements:
- Time horizon
- Loss percentage
- Level of confidence
For example, VaR can be used to answer questions related to a bank’s risk exposure in a particular duration of time with a particular level of confidence. These include:
- What is the maximum amount that could be lost over the next month with a 95% or 99% level of confidence?
- What is the maximum percentage that could be lost over the next year with a 95% or 99% level of confidence?
These questions illustrate that the VaR metric has three main elements—a relatively high level of confidence (typically either 95% or 99%), a time period (a day, a month or a year) and an estimate of investment loss (expressed in a currency or percentage terms).
It can therefore be concluded that VaR is based on assessing the maximum loss expected (or the worst situation for an investor) over a time period with a specific level of confidence. Let us take an example to understand this.
Let us assume that a bank has determined the following information of a portfolio:
VaR = USD 100 million
Confidence Interval = 95%
Duration: 20 days
This information implies that the portfolio is expected to lose a maximum amount of USD 100 million in nineteen out of twenty days. Alternatively, the portfolio is expected to lose more than USD 100 million in one out of twenty days.
Scenario Analysis
A scenario can be defined as a development and unfolding of events. Scenarios are used in various ways for estimating the financial vulnerability of a bank. Scenario analysis is used to estimate what would become of a portfolio’s value in case an unfavourable event or worst-case scenario occurs in the financial environment. This method involves calculating different reinvestment rates for expected returns that would be reinvested during the investment time horizon of an asset/security.
The most common method of scenario analysis is to determine the standard deviation of daily or monthly stock returns. Then, the expected value of the portfolio is calculated in case each stock generated returns with standard deviations above or below the average return. Thus, an investor could be reasonably confident that the value of a portfolio is unlikely to fall below (or rise above) a specific value during a given time period.
Scenario analysis also helps in ranking the various risk management options available to banks and regulators based on their effectiveness. One of the applications for accomplishing the same is solvency testing and financial condition reporting. Assessing a bank’s financial strength is of fundamental concern for determining whether the bank has or is capable of arranging sufficient financial resources to meet all obligations.
Solvency testing assesses the austerity of the financial effect of different scenarios on a bank’s solvency. It is similar to stress testing in which bankers and regulators assess the degree of financial strain that a bank is able to withstand. It is often estimated with regards to the condition whether the bank can meet the regulatory capital requirements.
As you have studied earlier in the chapter that the objective of risk management is to identify, measure and report to the stakeholders, the types and extent of risks exposure of a bank. To accomplish these objectives, a risk manager uses scenario analysis.
Scenario analysis helps to:
- Formulate a range of scenarios to which a bank or financial institution is exposed to.
- Evaluate the effect of each scenario on the financial position of the bank.
- Discuss the outcome of these evaluations with the board and senior management and check their consistency with the bank’s risk appetite.
- Identify and suggest realistic measures to mitigate the effects of scenarios that lead to financial trouble.
Scenario testing is used in several ways by treasury managers. For specific risk scenarios, a range of scenario testing is conducted to quantify the bank’s exposure to those scenarios. Then the bank can determine measures in advance for responding to these possible events, especially by focusing on the worst-case scenarios.
Bank regulators advise all banks to test the same scenario and report the test results in a standard format. This report is later compiled to represent a sector-wise picture. Such a scenario is required to be defined clearly by the bank regulators to avoid inconsistency in interpretations, which might be applied by different banks. This may result in making the aggregate outcomes less useful for the assessment of risks.
Therefore, it is important that a balance is created between an overly detailed scenario (irrelevant for many banks) and a general scenario (applicable to most banks). Not only would this help in highlighting an individual bank’s weakness but the aggregate results and risk implications could be better assessed. Moreover, the expected effectiveness of scenario testing outcomes (required to mitigate a risk) to different scenarios may be appraised before implementation.
Figure 3.4 shows scenario analysis for assessing acceptable and unacceptable losses due to probable risk:
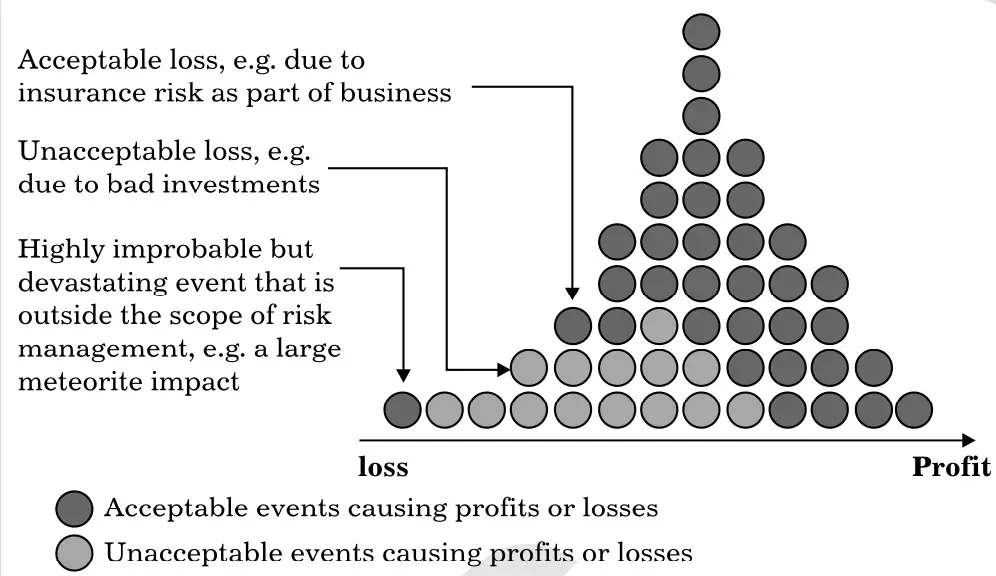
(Source: Stress Testing and Scenario Analysis, actuaries.org)
Sensitivity Analysis
Sensitivity analysis is another risk measurement technique used by banks and financial institutions. It is used to understand how risk estimates and risk-based decisions are dependent on other variables and factors that contribute to risk. In other words, sensitivity analysis identifies the parameters related to the risk estimates. It is used to identify and rank the critical issue of variability and uncertainty.
Sensitivity analysis can be conducted on more than one factor so that their impact over the given project can be analysed. In case of economic turbulence, more than one macro factor affects the entire economy simultaneously. Therefore, this test helps banks to assess the impact of those factors on their capital adequacy and profit.
Following are the purposes of performing sensitivity analysis by a bank:
- To make assessment of the stress impacting the capital of the bank.
- To make assessment of the stress impacting the profit of the bank.
- To make the backup plans so that the capital adequacy can be ensured at the time of stressed situation.


