
Risk-Return Trade-Off
Risk and return are two of the most important concepts that investors are interested in. Return refers to the financial gain that can be received from an investment. Risk refers to the degree of uncertainty that the actual return would be different from the expected.
Precisely, this is calculated in statistics through standard deviation. It has been empirically observed that higher level of risk is associated with higher level of returns. In other words, when the return increases, the probability of an investment giving that return decreases. This phenomenon that probable return goes up with increase in risk is called risk-return trade-off.
Table of Content
Look at the following Table that shows risk and average expected return in different asset categories in a hypothetical situation:
| Asset Type | Volatility (Risk) | Avg. Expected Annual Return |
|---|---|---|
| Stocks | High | 12% |
| Bonds | Medium | 6% |
| Money Market Funds | Low | 4% |
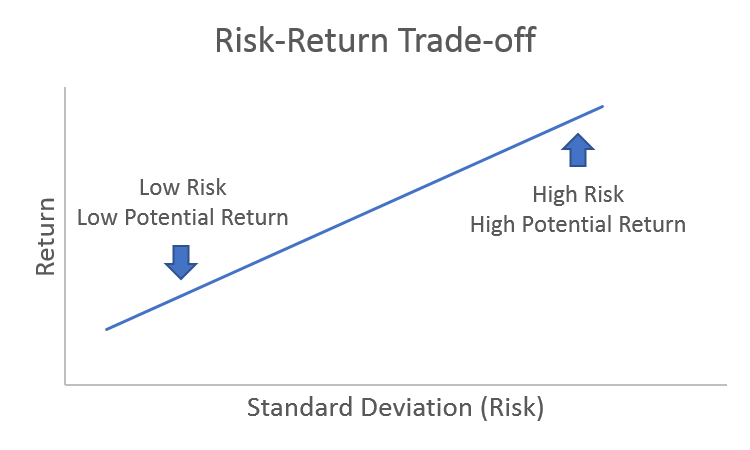
In other words, a risk-return trade-off denotes that low levels of improbability are linked with less probable returns, while high levels of improbability are linked with high probable returns. Figure 6.1 shows the risk return trade-off:
Figure shows that high standard deviation means high risk and high probable return.
Showing the Risk-Return Trade-Off
In risk return trade-off, the capital invested can bring higher profits only if it has the possibility of getting misplaced. Due to risk return trade-off, you should know the tolerance of personal risk while selecting investments for your portfolio. Taking risk is the rate of attaining returns; hence, if you want to earn high return, you cannot avoid the risks. The aim is to look for the right balance, the one that produces some gain, but still gives you some respite.
Security Market Line (SML)
Security market line is a line that shows the systematic or market risk against the return of the complete market at a particular period and displays all risky market securities. It is also known as the characteristic line. Beta is the measure of risk used by SML. SML fundamentally shows the results from the assets pricing model CAPM formula. The x-axis shows the risk (beta), and the y-axis, the anticipated return. The market risk percentage is ascertained from the SML grade.
Figure shows SML:
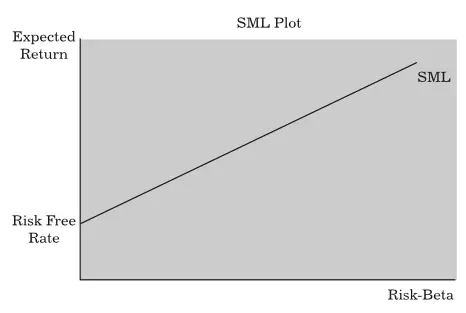
Security Market Line
We can see that the line begins with a risk-free rate and then makes an upward-right movement. We can see that the return increases with increase in the risk level. Therefore, risk-averse investors would like to invest towards the starting point of SML. On the other hand, high risk profile investors would like to select investments higher along the SML.
Estimating Security Market Line
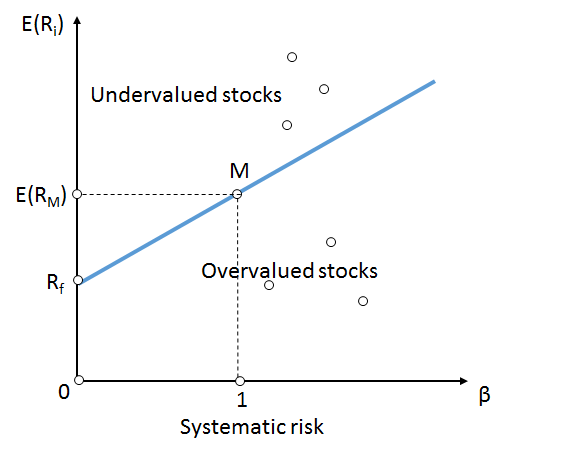
The security market line is used for ascertaining if an asset can be taken into consideration for a portfolio giving a practical expected return for a risk. Separate securities are marked on the SML graph. If the security risk against the anticipated return is marked on top of SML, it has no value since the investor can anticipate more returns from an inbuilt risk.
A security marked below the SML is overrated since the investor could receive less return for the level of risk assumed. The Y-intercept is equal to the risk-free interest rate. The SML slope is equal to the market risk premium and shows the risk return trade-off at certain given time.
The following equation shows the anticipated calculated values from SML:
SML: E(Ri ) = Rf + βi [E(RM) – Rf ]
Where:
E(Ri ) is the expected return on security
E(RM) is the expected return on market portfolio M
β is the nondiversifiable or systematic risk
RM is the market risk
Rf is the risk-free rate
Now, let us consider an example. Suppose, a project’s beta is 2 when a fresh product line is taken into consideration. Also, the rate of riskfree return is 4% and the anticipated return on the market is 12%. Now, let us calculate the cost of equity for the new product line.
The cost of equity of the new product line would be:
= Rf +βi [E(RM) – Rf ]
= 4 %+2(12%-4%) =20%
Figure shows the SML slope:
SML Slope
SML when used in portfolio management shows the prospect cost of investment, investing in combined market portfolio marked above the line are undervalued because they give high return for a given number of risks (beta). The assets shown below the line are overvalued as they give lower return due to given number of risky and risk-free assets. All accurately rated securities are marked on the SML.
Now, the question is, what does SML look like when beta is negative? These assets will be accepted by a coherent investor even though they give sub risk-free returns, since they give recession insurance as part of well diversified portfolio. Hence, the SML remains in the straight line whether beta is positive or not. The other way of thinking is that the real value of beta shows the number of risk linked with the asset, while the sign shows when the risk will happen.


