
What is Return on Investment (ROI)?
Return on investment, or ROI, is an indicator of profitability. In accounting terms, ROI, is found by dividing the net profit by the total assets.
So if your net profit is ₹1000 and your total assets are ₹40,000, then your ROI would be 0.4 or 40 percent. Return on investment is a measure of profitability but is not the same as profit. ROI depends on the amount of investment made in a company stock or elsewhere and on the net profit of the business in which the investment is made. Profit measures the performance of a business.
Table of Content
Components of Return
Return is not just the amount of dividend that a person receives on investment. It also includes the price growth or the capital appreciation of the stock that occurs over a period of time. Therefore, for making an investment both dividends and price growth should be considered while calculating the rate of return.
Figure shows the two components of return:
The components of return are discussed as follows:
Capital Appreciation
It is the difference between the amount paid by an investor to purchase an asset or security and the amount at which the asset or security can be sold. In other words, it is the increase in the price of assets over a period of time. This will enable the investor to earn profits or get returns from an asset by selling them at the time when the value of capital appreciation is positive and high.
For example, suppose a person bought 100 shares of ABC Company three months ago at the price of ₹10 per share. Now, after three months, the value is increased from ₹10 to ₹50. This implies that the value of the investment has increased from ₹1000 to ₹5000. Therefore, the amount of capital appreciation would be ₹(5000 – 1000) = ₹4000.
Income
It is the income obtained by an individual by investing in an asset or security. This income is in the form of dividends, distributions, and interest on the invested amount. This is the amount get by the investor along with the amount obtained from capital appreciation of the asset.
For example, if a person buys a bond, let’s say for a period of 10 years, he would receive interest annually or bi-annually as per the terms of bonds. The interest received on a regular basis would serve as income for the person from the investment made by him.
However, in case of assets that do not pay dividends, the total return from an asset involves only one component, i.e., capital appreciation.
Measuring Returns
It is important for an investor to know how much returns he/she can get by investing in an asset. For this purpose, the investor needs to measure the expected returns from the asset. There are various measures that help in determining the returns from an asset. Some of these measures are discussed as follows:
Return on Investment (ROI)
It is one of the widely used measures of determining returns from an investment. This measure uses the all the cash flows generated from an asset to determine the expected return on it. These cash flows include dividends, interest, return of principal and capital gains. The formula for calculating ROI is as follows:
ROI = [ (Net Returns from investment – original cost of invetsment ) / Original amount invested ] × 100
For example, a person bought ₹1,000 worth of stocks. After keeping the shares for two years, he sold them for ₹1,500. He made the net profit of ₹500. In this case, ROI would be calculated as follows:
ROI =
[ (1500 – 1 000) / 1000 ] x 100 = (500/1000) ×100 = 50%
Thus, ROI would be 50%.
It is also used as a measure by investors to determine the return from an asset. Risk premium is the high returns obtained by an individual by investing in a growth stock having high risk, versus a stock from the stock of a more established company. For example, investment in a new firm may offer high risk premium due to low scale operations and high risk of failure in market.
Therefore, if the company succeeds, it should provide high rewards to its investors for taking the risk with a high return. On the other hand, a large company, let’s say General Electric (GE), is a well-established name in the market; thus is unlikely to fail. Therefore, risk premium for investing in GE is low as investments in a big company are generally considered safe and pose low risk of failures.
Expected Return
It is the mean of the probability of possible rates of return. Expected return is used for predicting the future value of a portfolio and also act as a guide for measuring actual returns. The formula for calculating expected return is:
Where,
Ri is the return in scenario i
Pi is the probability for the return Ri in scenario i
i is the number of scenarios.
For example, consider a simple portfolio of two mutual funds, wherein one invests in stocks and the other one in bonds. Now, suppose an investor expects the stock fund to return 10% and the bond fund to return 6% and the allocation of both funds is 50% to each mutual fund. In this case, expected return would be calculated as
Expected return (portfolio) = (0.1)×(0.5) + (0.06) × (0.5) = 0.08, or 8%
Benchmark Portfolios
It is one of the common measure used by investors for evaluating the portfolio returns. In this measure, the portfolios are compared with a benchmark, such as an index, for determining the expected return from an asset. For instance, let’s say the XYZ is a portfolio management company that uses the Russell 2000 index for benchmarking. If the portfolio returns of XYZ at the end of the year is 8.6%, and Russell 2000 (the benchmark) returns 8.0%, then the portfolio is said to exceed its benchmark.
Some of the most commonly used benchmarks are:
- Standard & Poor’s 500: This is used as a benchmark for determining the returns from large-cap stocks.
- Russell 2000: It is used for measuring returns from small-cap stocks.
- Europe, Australia and Far East Index (EAFE): This is used as a benchmark for determining returns from international stocks.
Holding Period Return
It is the return get by an investor for the time period he has held the stocks. It is a good measure of return for short-term investments. However, the variability in return from a stock is highly affected by the holding period. If the holding period is short, the variability in the returns from stock will be more. On the other hand, if the holding period is long, the variability in the stocks’ returns will be less. Holding period return can be calculated as follows:
Holding Period Return =Income + (End of Period Value – Initial Value) / Initial Value
For example, suppose an investor purchased a stock a year ago at ₹5000 and received ₹500 in dividends over the year. What would be the HPR for the investor, if the stock is now trading at ₹6000?
HPR = [500 + (6000– 5000)] / 5000 = 0.3 = 30%
Excess Returns
It is the amount of return that an investor get above the expected return on the basis of the beta of the stock or portfolio. For example, an investor expects his portfolio to return 12% next year, while the portfolio actually returns 15%. Here, the excess return on the portfolio would be 15% – 12% = 3%.
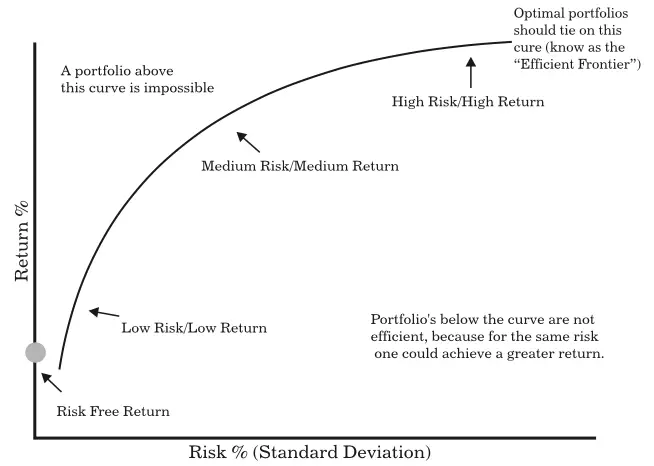
Selecting the Optimum Portfolio
Irrespective of the type of investor, the optimum portfolio means that the investor expects the highest level of returns on his/her investment and he/she wishes to minimize the risk. The Investors reduce the risk on investments by diversifying their portfolio and including many securities instead of investing in just one security. For selecting an optimum portfolio of investment, it is important for an investor to study the relationship between risk and return of the various schemes.
Figure shows the relationship between risk and return:
Some other points that need to be considered to get the targeted return are:
- The fund flows that the scheme creates
- The time that the fund discharge shows in the scheme
- The previous work of the scheme artifacts
- The rate of inflation
For selecting an optimum portfolio, an investor needs to evaluate the portfolio based on two aspects, namely technical aspect and personal aspect.
These two aspects are discussed as follows:
- Technical Aspect: The technical aspect of selecting an optimum portfolio can be divided into two parts, which are:
- One-Step Optimisation: It is the allocation of securities along the Capital Market Line (CML) from the bottom to the top. CML refers to a straight line that shows the relationship between risk and return of an asset.
- Two-Step Optimisation: It is considered to be the most organised method of selecting the optimum portfolio by an investor. This is also termed as the top-down process. It is generally used by financial institutional investors. The process of selecting optimum portfolio using two-step optimisation is as follows:
- Investor divides the total investment into risky and risk-free assets. In addition, the investor determines the proportion of investment he will made in the risky and risk-free assets.
- Investor identifies the different portfolios he can make by diversifying the risk among different sources, such as stocks, debt capital, and fixed assets.
- From the identified portfolios, the investor selects the one that provides him/her the maximum returns and this will be considered as the optimal portfolio for the investor.
- Investor divides the total investment into risky and risk-free assets. In addition, the investor determines the proportion of investment he will made in the risky and risk-free assets.
- Personal Aspect: It involves the selection of the optimum portfolio based on the behaviour and attitude of investors. The following points needs to be considered while selecting an optimum portfolio based on this aspect:
- Return on Investment: If the investor wants higher returns from investing in a portfolio, he/she needs to take high risk associated with the investment. The high return obtained from the investment will compensate the risk involved. Thus, the investors who are looking for high returns will select a portfolio that includes securities with high risk and high return.
- Risk Involved in Investment: The investors who consider risk as a threat instead of an opportunity to earn money will prefer a portfolio with no or minimum risk.
- Future Growth: Some of the investors take future growth of the portfolio into account while selecting a portfolio. They select a portfolio that is profitable to them in the long term.
- Return on Investment: If the investor wants higher returns from investing in a portfolio, he/she needs to take high risk associated with the investment. The high return obtained from the investment will compensate the risk involved. Thus, the investors who are looking for high returns will select a portfolio that includes securities with high risk and high return.
Let us study how an optimum portfolio is selected with the help of an example. Consider a portfolio of three stocks A, B and C. As you have studied that to select the optimum portfolio, the risk associated with it needs to be analysed. Moreover, each portfolio contains a unique RISK/RETURN profile due to different cash/stock allocations.
Table displays the risk return profile for stocks A, B and C:
| Risk | Expected Returns | Returns of Stock A | Returns of Stock B | Returns of Stock B |
|---|---|---|---|---|
| 9.5% | 11.21% | 18% | 19% | 65% |
| 10.0% | 11.75% | 20% | 16% | 63% |
| 10.5% | 11.96% | 23% | 14% | 57% |
| 11.2% | 12.20% | 27% | 20% | 60% |
| 11.5% | 12.5% | 30% | 23% | 42% |
By seeing the table, one can deduce that the optimal portfolio configuration would be the one that gives a return higher than 11.21% at a risk of 9.50%.
Return on Common Stocks
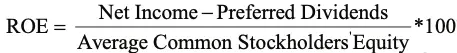
Return on common stocks or equity (ROE) refers to the profit generated by an organisation with the money invested by the common shareholders. It is calculated as follows:

For example, assume that ABC Ltd. earned a net income of ₹4,22,000 ending march 31, 2014. The shareholders’ equity on April 30, 2013 and March 31, 2014 was ₹16,58,000 and ₹16,33,000, respectively. Calculate its ROE for the year ending March 31, 2014.
Solution
Average Shareholders’ Equity = (₹16,58,000 + ₹16,33,000 ) / 2 = ₹16,45,500
Therefore, ROE = ₹4,22,000 / ₹16,45,500 ≈ 0.25 or 25%
This means that every rupee of common shareholder’s equity earned about ₹25 in the year.
In case of preferred stocks, ROE is calculated as follows:
Where,
Average Common Stockholders’ Equity = Average Total Stockholders’ Equity – Average Preferred Stockholders Equity
Some key points related to return on equity are:
- The weighted average of the number of shares during a year is used for ROE calculation, if new shares are issued.
- High growth companies give a higher return on equity
- The average return on equity for the past 5 to 10 years gives a better idea of the historical growth
Let us understand the concept of ROE with the help of an example.
An investor wants to calculate the ROE of an organisation. So, he gathers the following data related to the financials of the organisation:
| Net operating income | 4,50,000 | |
| Interest expenses | 65,000 | |
| Net income before tax | 3,85,000 | |
| Income tax (30%) | 1,15,500 | |
| Net income | 2,69,500 | |
| 2013 | 2014 | |
| Preferred stock `100 par, 9% | 7,00,000 | 7,00,000 |
| Common stock, `12 par | 11,00,000 | 11,00,000 |
| Additional paid in capital | 50,000 | 50,000 |
| Total paid-in capital | 18,50,000 | 18,50,000 |
| Retained earnings | 4,00,000 | 2,50,000 |
| Total stockholders’ equity | 22,50,000 | 21,00,000 |
Average Common Stockholders’ Equity = Average Total Stockholders’ Equity – Average Preferred Stockholders Equity
Therefore, Average Common Stockholders’ Equity = (22, 50,000 + 21, 00,000)/2 – (7,00,000 + 7,00,000)/2 = 21,75,000 – 7,00,000 = 14,75,000
Preferred dividends =7,00,000 × 0.09 = ₹63,000
Thus, the ROE for the above data is calculated as follows:
ROE = 2,69,500 – 63,000 / 14,75,000 × 100 = 14%
ROE depicts how much net income is earned by an organisation from the capital invested by the common stockholders. So, ROE is considered as a measure of profitability from the perspective of common stockholders’, who are regarded as the real owner of an organisation. A high ROE shows that the profitability of the organisation is high. In addition, it also represents the strong financial position of an organisation in the market.
Estimating Expected Returns
There are many approaches to estimate the expected return of an asset or portfolio. One approach is to use historical data. Another method uses probability of different return outcomes. It is important to estimate the return of individual assets in the portfolio accurately because the return of portfolio depends on return the individual assets.
Aggregate Asset Allocation
Aggregate asset allocation involves the estimation of the amount or proportion of capital needs to be invested in different categories of securities, such as government securities, corporate bonds, international stocks, etc. An investor needs to determine the allocation of money in different securities in order to generate maximum returns. For example, an individual wants to invest in order to secure his future after retirement.
He needs to make a pension plan, wherein he needs to decide how much investment he needs to make in each asset category. This is basically called aggregate asset allocation decisions that are made based on the expected returns from each asset category. After determining the expected returns from each asset category, the investor is able to identify the asset categories that are profitable for him/ her and make the investment accordingly.
Let us see how the expected returns of an asset category is determined with the help of an example.
The expected returns from an asset category in case of three conditions are shown in Table:
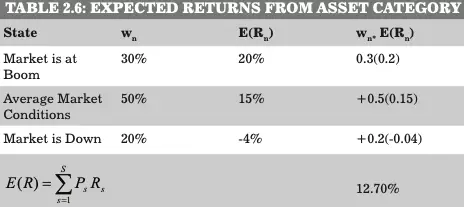
The returns from the above asset category show that this category is giving positive return even in the case of poor market conditions or when the market is falling. Thus, it can be considered as the safe option of investment. However, the asset allocation in the above example will highly depend on the risk taking capability of the investor and the strategy adopted by investor for asset allocation purpose.
Some of these asset allocation strategies are:
- Strategic Asset Allocation: In this strategy, the objective of the investor is to have an asset mix that provides him/her the optimal balance between the expected risk and return for a long-term period.
- Tactical Asset Allocation: Investors adopting this strategy try to have an asset mix of securities that are expected to provide high returns.
- Core-Satellite Asset Allocation: This strategy is basically the hybrid of both strategic and tactical asset allocation strategies.
- Systematic Asset Allocation: It is a strategy that works on three assumptions, which are:
- The market provides a good amount of information about the available returns on an asset category.
- Relative expected returns reflect consensus.
- Expected returns provide clues to actual returns.
- The market provides a good amount of information about the available returns on an asset category.
Forecasting Returns From Single Security
The returns from single security can be forecasted is determined based on the mean of the probable returns from the asset in future, which is actually the expected return. So, we can forecast the returns from single security using expected returns formula. In addition to it, the investors calculate standard deviation in the probable returns so as to identify the risk associated with an asset.
As you have already studied both these concepts, i.e., expected returns and standard deviation, in the previous sections. Let us directly move to the calculation of returns from a single security with the help of an example. An investor wants to determine in which of the two securities, i.e., A and B, he should invest in. For this purpose, he wants to forecast the returns on both of these securities.
The data of the return from the security and the probability of getting that return are shown in Table:
| Security A | Security A | Security B | Security B |
|---|---|---|---|
| Return (%) | Probability | Return | Probability |
| -20 | 0.05 | -10 | 0.05 |
| -10 | 0.05 | -5 | 0.10 |
| -5 | 0.10 | 5 | 0.15 |
| 5 | 0.15 | 10 | 0.25 |
| 10 | 0.25 | 18 | 0.05 |
| 18 | 0.05 | 20 | 0.25 |
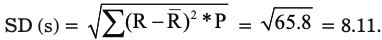
The calculation of expected return and standard deviation of security is shown in Table:
| Return (R) | Probability (P) | (P×R) | (R – R) | (R – R)2 | (R – R)2 × P |
|---|---|---|---|---|---|
| -20 | 0.05 | -1 | -22.15 | 491.7 | 24.5 |
| -10 | 0.05 | -0.5 | -12.15 | 148.2 | 7.4 |
| -5 | 0.10 | -0.5 | -7.15 | 51.8 | 5.1 |
| 5 | 0.15 | 0.75 | 2.85 | 7.6 | 1.1 |
| 10 | 0.25 | 2.5 | 7.85 | 59.6 | 14.9 |
| 18 | 0.05 | 0.9 | 15.85 | 250.4 | 12.5 |
| R = 2.15 | Total = 65.8 |
Expected Return of Security A (R ) = 2.15%
The calculation of the expected return and standard deviation of security B is shown in Table:
| Return(R) | Probability(P) | (P×R) | (R – R) | (R – R)2 | (R – R)2 × P |
|---|---|---|---|---|---|
| -10 | 0.05 | -0.5 | -9.5 | 90.3 | 4.5 |
| -5 | 0.10 | -0.5 | -4.5 | 20.3 | 2.0 |
| 5 | 0.15 | 0.75 | 4.25 | 18.1 | 2.7 |
| 10 | 0.25 | 2.5 | 7.5 | 56.3 | 14.1 |
| 18 | 0.05 | 0.9 | 17.1 | 292.4 | 14.6 |
| 20 | 0.25 | 5 | 15 | 225.0 | 56.3 |
| R = 8.15 | ∑(R R) *P − = 94.2 |
Expected Return of security B (R ) = 8.15%
SD (s) = 9.70%
From the above calculation, it can be seen that the security A has a slightly lower risk in comparison to security B (lower standard deviation value). However, the return from security B is much higher than security A. Thus, the investor would tend to select security B.
Stock Return Distribution
Stock return distribution is the process where determining the distribution of funds in various stocks gives clarity on the pattern of return generated. The distribution might be normal, or a logarithmic. By understanding the pattern of distribution and the returns, an investor can plan investment in better way.
The three types of distributions are explained as follows:
Normal Distribution
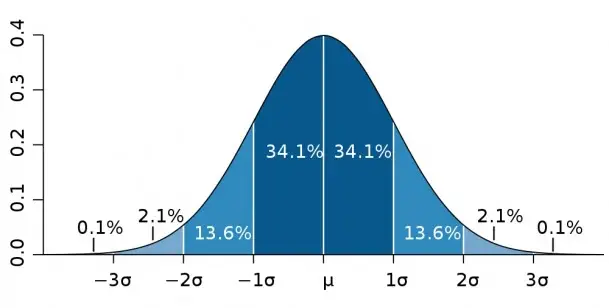
The normal distribution was introduced by Karl Guass; therefore, it is also called Guassian. The normal distribution is a model of continuous distribution. A normal random variable is capable of assuming any value on the real number line. The characteristics of a normal distribution are as follows:
- A bell-shaped and symmetrical distribution.
- A unimodal distribution as it has only one peak.
- In normal distribution, the mean, median and mode lie in the centre and have the same numerical values.
- The curve of normal distribution is asymptotic to the horizontal axis.
- It is completely defined by two parameters, namely mean (µ) of probable rate of returns (i.e. expected rate of return) and standard deviation (σ), which is the risk associated with an asset.
Lognormal Distribution
It is widely used in finance as it is assumed by many investors that stock prices are distributed lognormally. This distribution is non-zero and is skewed on the right side of the graph, which implies that the price of a stock cannot fall below zero but it can go as high as possible.
Figure shows lognormal distribution:
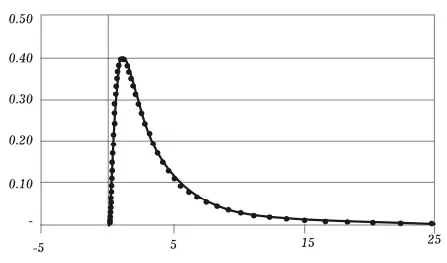
Lognormal Distribution
While stock returns generally have normal distribution, the stock price itself is often log-normally distributed. This happens due to the fact that extreme moves become less frequent as the stock prices approach zero. Cheap stocks, however exhibit few large moves and then become stagnant. Nevertheless, even the little price changes at these depressed levels correspond to large percentage changes.
This is because the base value is very low. For example, a 1 rupee price change corresponds to a hefty 5 percent if the stock is valued at `20. Therefore, the stock’s return is normally distributed whereas price movements are better understood with the help of log-normal distribution. The distribution of stock prices and returns helps investors to determine the probable gains and losses in their portfolio.
If most stocks in the investor’s portfolio exhibit large moves on both the up and the down side, the potential gains as well as losses would be large. Such a portfolio is suitable for a young investor having enough time until retirement to recover from a probable trading loss. On the other hand, an investor about to retire wold rather prefer a portfolio that is less likely to gain or lose significantly.


