
What is Ishikawa Fishbone Diagram?
An Ishikawa diagram is a diagram that depicts the causes of an event. It is commonly used in manufacturing and product development to explain the many steps in a process, highlight where quality control concerns may arise, and decide which resources are necessary at key moments. Kaoru Ishikawa created the Ishikawa diagram in the 1960s as a tool for monitoring quality control procedures in the shipbuilding sector.
Table of Content
Fishbone diagrams, herringbone diagrams, cause-and-effect diagrams, and Fishikawa diagrams are all terms used to describe Ishikawa diagrams. They are Kaoru Ishikawa’s causal diagrams, which show how an occurrence is caused. They have the appearance of a fish skeleton, with the “ribs” symbolising the causes of events and the end conclusion appearing at the skeleton’s head. The Ishikawa diagram’s objective is to help management figure out which issues need to be addressed to attain or prevent a specific outcome.
Fishbone diagram is shown below in Figure:
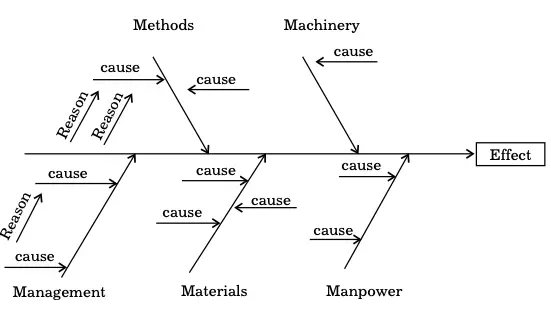
Fishbone Diagram
The Ishikawa diagram is also commonly used as a methodology for developing product designs that answer actual challenges. It can also be utilised to discover prospective components that are creating an overall influence on quality defect prevention. Each source of variation is a cause or reason for imperfection. To identify and characterise various sources of variation, causes are frequently classified into primary categories.
Process to Make an Ishikawa Diagram
A whiteboard, a flip chart and some marking pens are required to create an Ishikawa Diagram.
- A problem statement should be agreed upon by the group (effect).
- In the centre-right corner of the flipchart or whiteboard, write the problem statement, box it and draw a horizontal arrow to it.
- Create a list of the key causes of the problem.
- Draw the cause categories as branches of the main arrow.
- Make a list of likely causes. “Why does this happen?” you might wonder. The facilitator notes each concept as a branch from the appropriate category as it is presented. If a cause is related to multiple categories, it might be written in multiple places.
- Rephrase the query, “Why does this happen?” Continue to ponder the question “Why?” to uncover deeper layers of causes. Layers of branches illustrate cause-and-effect interactions.
- When the group runs out of ideas, pay special attention to the sections of the chart where there are few ideas.
How to Make a Fishbone Diagram
- Identify the problem
- Create branches for the categories of reasons from the main arrow
- Add branches to each category for reasons that are connected
- Analyse and assess the problem
- Select a template to adapt or create a mainline from scratch
- Identify the problem
Let us understand the Ishikawa diagram with the help of an example of service failure.
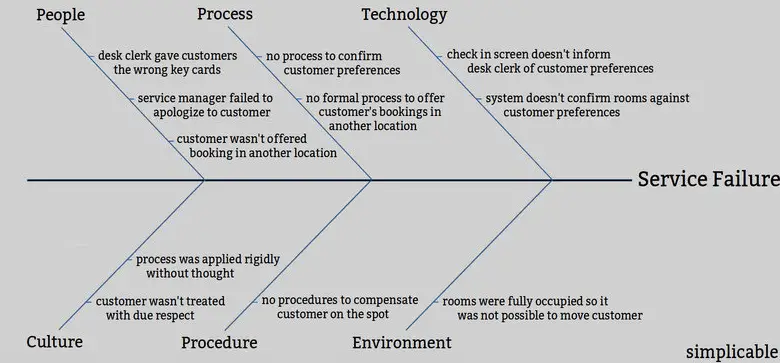
A customer asked for a suite in a hotel. However, the hotel booked a smoking room for the customer and handed over wrong key cards to him. Also, the hotel could not apologise or make corrections in the booking as it was a holiday season and the entire hotel was full. As a result, the hotel lost its customer and faced poor ratings and negative publicity.
Applications in Organisations
You all desire to improve the process and provide better outputs in any type of process, whether it is the manufacturing or service industry. One of the primary difficulties in quality improvement targets is process variance. You may be aware that there is a variation in a process, but we may not be aware of the core cause. You can utilise the Fishbone diagram and brainstorming to do this. Kaoru Ishikawa introduced the fishbone diagram to graphically represent all the reasons for process variation in a quality improvement strategy.
The Ishikawa diagram is another name for this diagram. This diagram resembles a fishbone structure, and it displays all of the likely sources of a specific problem. It is, in essence, a tool for exploring and displaying as many possible factors that may be causing a problem. As a result, you can conduct a root cause analysis and devise a viable remedy.
Types of Fishbone Diagrams
This diagram is commonly used for product design specifications and to prevent further quality issues. The reasons are divided into different categories here, making it easier to identify the source of variation. Some examples of common forms are as follows:
6 M’s Use in the Manufacturing Industry
- Method
- Material
- Manpower (Personnel)
- Measurement
- Mother Nature (Environment)
- Machine
4 S. Use in the Service Industry
- Suppliers
- Systems
- Surrounding
- Skills
This figure can be utilised in a variety of industries, including production, service and medical research. You can also tailor the categories of reasons to our specific needs. It uses brainstorming approaches to identify all potential reasons and presents them in the form of a diagram. Then it takes corrective action, resulting in a solid solution. Some of the most prevalent classifications based on industry categories have already been covered.
When to Use the Fishbone Diagram?
- To comprehend the relationship between cause and effect in a process
- When we need to get rid of all of the root issues at once
- For improvising and designing processes
- To make a procedure more efficient
Benefits
- The more you know about a subject, the simpler it is to grasp it
- It assists in quickly identifying and eliminating the root problems
- Better options for process improvement goals are included
- It also makes it easier to put corrective measures in place
Numerical on Productivity
The problem must be a desirable or unwanted event marked by the risk that must be treated (minimised) or exploited (capitalised). The following conditions must be met for the problem to be addressed using a Fishbone diagram:
- It must be characterised by risk (R = p × I), which means that the probability of occurrence and its impact can be determined.
- It must be a management objective with operational valence.
- The causes producing it must be characterised by probability, possibility, or frequency of occurrence.
- In turn, main causes must be considered as effects (secondary or of second-order) and sub-clauses; it must be a management objective with operational valence; it must be a management objective.
- There must be no objective correlations, which means that the effect must not become the cause, regardless of its position on the diagram.
The identification of primary and secondary causes, as well as their formalisation, must meet the same requirements as the identification and formalisation of problems, plus the following:
- A priority criterion, a specific chronological order (chronology), or a specific likelihood, possibility, or frequency of occurrence can be determined.
- There may or may not be one or more secondary causes to the primary causes.
- If the inquiry is whether these causes are endogenous to the system that the impact defined by risk belongs to or is external to the system (belonging to the environment), the answer is yes.
- The number of primary and secondary causes must be conducive, with not excees of 7-9 main reasons and 2-3 minor causes per main cause.
- Names furnished must be representative and allude the cause-effect relationship, while also being able to be characterised by perils that enroll in the cause’s relevance.
- Names given must be representative and suggestive for the cause-effect relationship, while simultaneously being able to be characterised by risks that enroll in the cause’s relevance.


