
CRM analytics are data that show how well an organisation performs in terms of sales and customer service operations. CRM analytics also provides information about customers that companies may utilise to make more informed business decisions. Typically, CRM software will be used to gather CRM statistics as well as to automate all of the data collection and report production processes.
Table of Content
Types of Data Analysis
Online Analytical Processing (OLAP)
When data is stored in a data Mart, OLAP technologies allow it to be exposed to analysis and ad hoc inquiry through the use of techniques such as slice and dice, drill down, and roll up. Generally, a data mart is used as a subset of a data warehouse. The duties of the business unit, department, or team that is in charge of the data mart are reflected in the Subset.
For example, a sales department would possess a data mart containing exclusively sales-related information. The data that is imported into the data mart would be determined by the type of analysis that users of the mart would like to perform on the data. This feature is beneficial to many different CRM users who have a variety of different inquiries to ask of the data. Salespeople might do an analysis of their territory in order to assess revenue and profit by customer. Call response rates and timings can be analysed by service personnel.
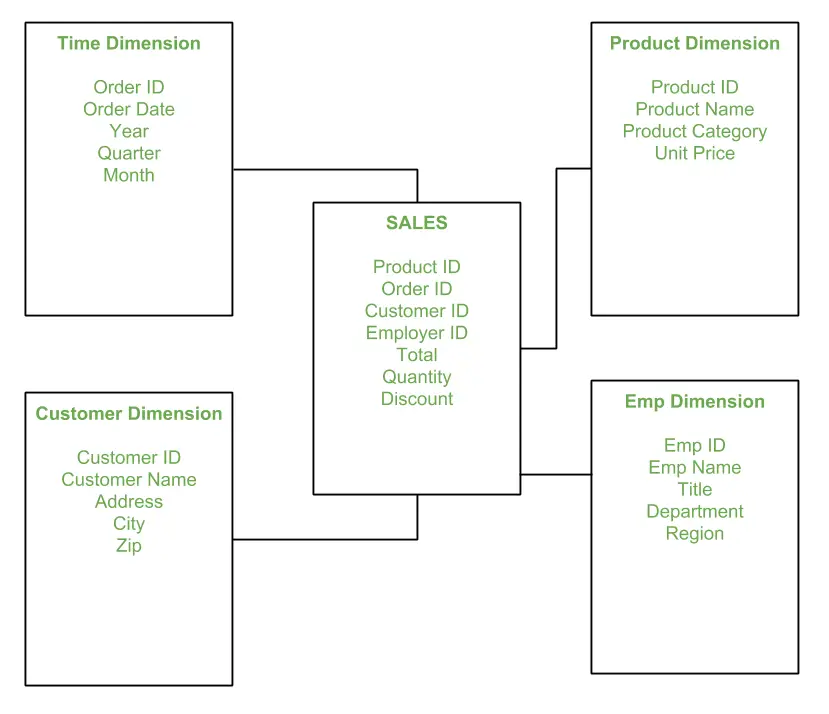
As illustrated in the figure, data that will be analysed using OLAP is stored in one or more star schemas. A star schema parts data in two sub-divisions: facts and dimensions. In quantitative data, such as sales revenues and sales volume, facts can be found. These facts have a number of dimensions in common.
Data can be disaggregated and examined in a variety of ways depending on the dimensions used. It is possible to segment sales revenues according to these dimensions: region and time, for example. Dimensions can be arranged in a hierarchical fashion. It is possible that the geography dimension will have the hierarchical levels of nation, state, and city, and that the dimensions will contain the hierarchical levels of year, month, and day.
Figure shows the example of a star schema: fact table and dimension:
OLAP helps user explain why facts are as they are by reference to dimensions. For example, if sales in Germany are slowing down, the user can drill down from national sales data to sales by metropolitan area to determine whether the problem is located in a specific region. Finding the cause of a problem may become possible by gradually drilling down into the hierarchical tiers of a company’s hierarchy. The analyst can investigate other dimensions of the problem, such as time and product class if the problem does not appear to be limited to a particular metropolitan location.
The following graphic shows an example of a star schema, which comprises a centre fact table surrounded by numerous type dimension tables, giving it the appearance of a star. Because of this data structure, it is feasible to undertake a wide variety of different types of analysis.
Users could acquire answers to inquiries such as the following by consulting the tables depicted in Figure above.
- What kind of discounts are available to client X?
- What is the variation in the number of packages shipped from year to year?
- What is the total number of units sold of product ABC?
Instead of one or two-star schemas arranged around a core fact table, a data warehouse will often contain numerous star schemas, each of which is organised around a central fact table depending on customers, opportunities, service requests, activities, and so on. In the case of customers, for example, the customer schema may include information such as customer sales revenue statistics, customer sales volume, cost of goods sold, profit margins, discounts, and promotional expenses among other things.
OLAP tools can also be used to assist in the execution of real-time choices. For example, propensity-to-purchase metrics can be sent to a call centre worker while the consumer is still on the phone with the company. This enables a more customised offer to be provided to the customer, which increases the likelihood of a positive reaction from the customer. Another technique of delivery is to use trigger points to deliver the message (e.g., when a customer logs more than a certain number of services calls in a month).
An alert mechanism such as an email, SMS, or another alert mechanism is used by the analytics application to convey the relevant information to the user. This strategy, also known as publish and subscribe, is a strong management tool that may be used in a variety of situations. It is possible to find several players in the business analytics sector who provide users with OLAP capabilities. Tableau, Qlik, Microsoft, IBM, SAS, SAP, and Oracle are just a few of the big providers. Database manufacturers also offer OLAP capabilities as part of a comprehensive package of products and services.
Clickstream Analysis
When it comes to websites, clickstream analysis is the process of collecting, analysing, and reporting aggregate data on which pages visitors visit in what sequence – which are the result of the succession of mouse clicks each visitor performs – and how long they spend on each page. When it comes to clickstream analysis, there are two levels:
- Traffic analysis: It is performed at the server level by collecting clickstream data, which is information about the path that a user takes while travelling through a website’s navigational structure. The study keeps note of how many pages are served to a user, how long it takes for sites to load, how often a user uses the browser’s back or stop button, and how much data is transmitted before a user moves on to the next page.
- E-commerce analysis: Clickstream data is used in e-commerce-based analysis to measure the success of a website as a channel to market by quantifying the behaviour of users while they are on the website. It is used to keep track of which pages the user spends the most time on, what things the user adds to and removes from their shopping cart, and which items the user purchases.
Because clickstream analysis can collect a huge amount of data, many e-businesses rely on pre-programmed apps to assist in the interpretation of the data and the generation of reports on specific areas of interest. When combined with other, more traditional market evaluation resources, clickstream analysis is considered to be the most effective method of market evaluation.
Personalisation and Collaborative Filtering
Personalisation
Personalisation can be defined as matching of services, products and advertising material to individuals. According to a 2004 Choice Stream survey (Greenspan 2004), surfers are willing to share personal information in order to get customised content and service. The matching procedure is based on what a corporation knows about the specific user. This knowledge is commonly referred to as a user profile. The user profile defines client preferences, behaviours and demographics.
Profiles can be generated in numerous ways. The major strategies used to compile user profiles include the following:
- Solicit information directly from the user: This is typically accomplished by asking the user to complete a questionnaire or by conducting an interview with the user in question.
- Observe what people are doing online: The usage of cookies, which are small data files that are saved on a user’s hard disk without the user’s knowledge or agreement, is a prevalent method of tracking what people are doing online. It is sent by a web server via the Internet, and the information stored will be displayed when the user’s browser reaches the exact web server again.
The cookie will also gather information about the user’s activity while visiting the site (see cookiecentral.com). As described in Insights and Additions 4.1, the usage of cookies is one of the most contentious problems in the European Commission. Other malicious tools, such as malware and Web bugs, are discussed in further detail in Section 4.4. Consult Chan for an overview of the concept of personalisation in EC (2005). - Build from previous purchase patterns: In contrast to asking customers using cookies or conducting market research, Amazon.com constructs customer profiles to propose books, CDs, and other things based on what they have purchased in the past, rather than asking customers directly.
- Perform Marketing research: Firms can do market research utilising methods like as data mining, as defined in online appendix W4A, to better understand their customers.
- Make inferences: Draw conclusions based on information provided by customers or other issues, or by comparing and contrasting customers.
An organisation matches the customer profile it has created with a database of products, services, or other material once it has been created. Manual matching is time-consuming and expensive; as a result, software agents are typically used to complete the matching process for users. One-to-one matching can be accomplished through a variety of different approaches and techniques. Collaborative filtering is one of the most well-known techniques.
Collaborative Filtering
Following the discovery of a consumer’s preferred product or service, it would be advantageous if the company could forecast, without having to ask, what other products or services the consumer would love. This can be accomplished through collaborative filtering, which utilises customer data to infer interest in other products or services from those who have already purchased them. This prediction is based on a particular formula that was developed in the field of behavioural studies.
More information on the methods and formulas utilised to implement cooperative filtering can be found in Vezina and Militaru (2004) as well as Zeng et al. (2006). (2004). Predictions can also be based on what marketers know about other consumers who have similar profiles to the ones being predicted. Firefly, a pioneering filtration system that is now included into Microsoft’s passport system, was one of the first. In many cases, collaborative filtering is used to personalise the user’s experience (e.g., backflip.com and choicestream.com).
The following are some variations of collaborative filtering:
- Rule-based filtering: Consumers are asked a series of yes or no or multiple-choice questions by a corporation, which is known as rule-based filtering. The inquiries may range from personal information to the precise information the user is seeking for on a certain website, and they may be repeated multiple times. Certain behavioural patterns can be expected based on the information gathered thus far.
The collaborative filtering system creates behavioural and demographic criteria from this information, such as “If the customer’s age is greater than 35 and the customer’s income is larger than $100,000, show the Jeep Cherokee advertisement.” Otherwise, the Mazda Protégé advertisement will be displayed. - Content-based filtering: Using this strategy, vendors ask users to identify which products they prefer from a list of options. The vendor’s system will offer more goods to the user based on their choices and the information provided by the user. This technique is somewhat complicated due to the fact that mapping between different product categories must be accomplished ahead of time.
- Activity-based filtering: Filtering rules can also be developed by observing the user’s online behaviour.
Legal and Ethical Issues in Collaborative Filtering
Users’ personal information is regularly acquired without their knowledge or permission, and this is illegal. As a result, various ethical and legal difficulties, including issues of invasion of privacy, are raised. A number of firms provide authorisation and develop customising solutions. Companies use these to solicit consent from customers to send them questionnaires and advertisements. It may also lead to the shilling attacks.
In a recommendation system where everyone can give ratings, people may give many positive ratings for their own items and negative ratings for their competitors’. It is often necessary for the collaborative filtering systems to introduce precautions to discourage such manipulations.
The users whose opinions do not consistently agree or disagree with any group of people and thus do not benefit from collaborative filtering. These are called black sheep and are a group whose idiosyncratic tastes make recommendations nearly impossible. Although this is a failure of the recommender system, non-electronic recommender also have great problems in these cases, so having black sheep is an acceptable failure.


