
What is Digital Analytics?
Digital analytics is the practice of collecting, analyzing, and interpreting data from digital sources such as websites, social media, mobile applications, and other online platforms. The main goal of digital analytics is to gain insights into user behavior and preferences, understand how users interact with digital products and services, and identify opportunities for optimization and improvement.
Table of Content
- 1 What is Digital Analytics?
- 2 Role of Data and Analytics in Digital Marketing
- 3 Types of Data Analysis
- 4 What is Web Analytics?
- 5 Steps of Web Analytics Process
- 6 Types of Web Analytics
- 7 Web Analytics Metrics
- 8 SEM Analytics
- 9 Web Analytics Tools
- 10 Social Media Analytics
- 11 Emerging Trends in Digital Analytics
Role of Data and Analytics in Digital Marketing
Most organisations and brands having an online presence actively seek to find information about their online data as data plays an important role in the success of digital marketing. Social networking platforms and websites create huge amounts of data. This data can be accessed and analysed on a regular basis to generate useful information. Analysis of such data allows digital marketers or business users to make faster and better decisions.
Using advanced analytics techniques, businesses can examine data sources to gain new information and perceptions about their business, which can lead to faster and better decisions. Digital analytics helps businesses use digital or web data and use the data to identify new opportunities leading to smarter and well-calculated business moves, happier clients, higher revenues and improvement in the user experience.
Social media websites and website traffic generated by them is the major source of data generation. Data has proven to be an asset for the organisations. Marketers gather and analyse the digital data that describes the nature of visitors, their likes and brand affinities. Digital data has been fuelling the strategy initiatives.
Online data is analysed by the organisations to help improve online experience of visitors and customers. However, it is not easy to measure the effectiveness of digital marketing without data. There are various ways of collecting online data. One of the oldest and most effective method is weblog or server log. It is a data collection method that collects information about the server activity. These are created and maintained by the server of the website automatically.
Weblogs consist of details regarding the IP address of the visitors, date and time stamps, bytes served, user agent, referrer, HTTP code, etc. Such details are not public in nature. However, these can only be accessed by the admin of the server, wherein the site is hosted. Nowadays, third-party hosting services offer analytics in a package that provides behavioural data from the websites.
Digital analytics offers the following information to digital marketers:
- Who is the target audience?
- What elements of your website are causing a high bounce rate?
- How to retain the customers?
- How to increase lead generation and nurturing?
- How to foster upselling?
- How to drive traffic to your website?
In the past, the reason why digital marketing strategies were not able to achieve the desired results was related to the incompetence to analyse the data. In the current scenario, there are various metrics available to measure or analyse data.
Types of Data Analysis
Digital media is the greatest source of consumer-related online data. For businesses in the digital media landscape, it has become important to use data and derive valuable information with respect to their prospective customers.
To get actionable insights from the digital analytics, three types of data analysis can be performed, which are behaviour analysis, outcome analysis and experience analysis. Let us understand each of these in detail.
Behaviour Analysis
Behaviour analysis helps in understanding the intent of the visitors. Traditionally, this type of data analysis is known as the clickstream data analysis. It involves collection, analysis, and report of visitor data. The visitor data contains information on what all pages have been clicked or visited by the visitors and in what order.
Behaviour analysis can be assessed by various Key Performance Indicators (KPIs), such as visits, sessions, time on site, page views, bounce rate, average session duration exit pages and traffic sources. Behaviour analysis is performed by tracking users with cookies.
One can analyse the behaviour of visitors by mapping what do they do on site and what elements and webpages are fostering the engagement. Track the user behaviour on different browsers to monitor that the site works properly on different browsers.
Outcome Analysis
The outcome of interactions on the website is crucial for the success of digital marketing efforts. Marketers are more interested in knowing the number of conversions and revenue generated as a result of increased visitors on website.
For marketers, getting clicks, sessions, and impressions is not enough. Marketers need to analyse the number of conversions and business outcomes. Some of the important outcomes can be measured using metrics such as conversion rate, visitors’ frequency, new visitors, return visitors’ conversions, etc.
Experience Analysis
This analysis is performed to know the experiences of visitors and recognise if the Webpage has served its purpose. It is crucial to carry on research on a continuous basis to assess whether or not the visitor found the information that they were looking for.
There are various metrics available to know and assess the experience of visitors on a website, such as site visits, usability test, site surveys or A/B testing.
What is Web Analytics?
Web Analytics refers to the collection, measurement, analysis, and interpretation of data related to a website’s performance and user behavior. It involves tracking various metrics and key performance indicators (KPIs) to gain insights into how users interact with a website, which helps businesses and website owners make informed decisions to improve their online presence, user experience, and overall digital strategy.
The success of any business depends upon its ability to collect, understand and use data (with respect to its customers, competitors, and partners) that it collects from miscellaneous sources. Web analytics is one such means to collect and use data. Web Analytics refers to the process of collecting, processing, and analysing website data such as website visitor activity.
The use of Web analytics helps an organisation in the following ways:
- Gauging the effectiveness of marketing campaigns
- Finding problems in online services and improving them henceforth
- Increasing profitability of advertisements and sales by creating customer profiles
- Gaining knowledge with respect to customer preferences and behaviour
- Improving business performance
- Measuring website traffic
- Acting as a tool for market research
- Tracking bounce rate
- Optimising and tracking marketing campaigns
- Selecting the correct target audience
- Optimising websites
- Improving Web services
- Optimising conversion rate (Conversion Rate Optimisation (CRO))
Steps of Web Analytics Process
Generally, there are four steps involved in the Web analytics process as shown in Figure:
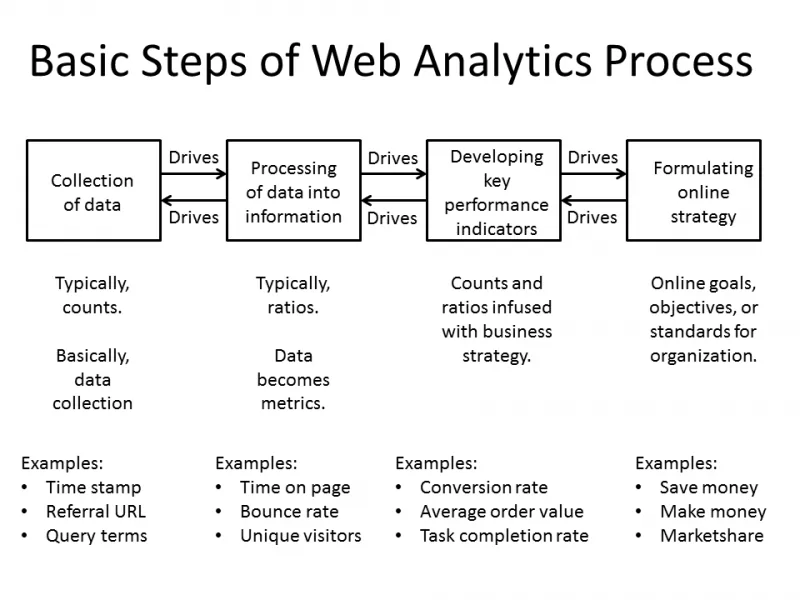
- Collection of data: At this stage, the basic data, which are usually counts of things are collected.
- Processing data into information: At this stage, data in form of counts is taken and converted into the form of information, i.e., ratios and metrics.
- Developing KPIs: At this stage, the counts, ratios and KPIs are taken and these are mixed with business strategies to develop the Key Performance Indicators (KPIs).
- Formulating online strategy: At this stage, an organisation reviews all the analytics information along with its objectives and decides strategies for increasing profits and market share
Types of Web Analytics
Analysts have also developed experiments and testing for optimisation of websites. For example, A/B testing is a controlled experiment with two variants in an online setting.
There are two types of Web analytics as follows:
Off-site Web Analytics
The off-site analytics result in retrieving off-site metrics that can be obtained irrespective of a website’s presence. In other words, off-site metrics refers to web measurement and analysis of a website’s potential audience, visibility and buzz (comments) on the Internet irrespective of whether or not a person owns or maintains a website.
On-site Web Analytics
The on-site analytics result in retrieving on-site metrics that can be obtained when a visitor actually lands on a website. In other words, on-site analytics measure a visitor’s behaviour when he visits any specific website.
Such metrics help in finding the relation between landing pages and online purchase. The data retrieved using on-site web analytics is compared against the Key Performance Indicators for measuring performance and for improving the website of a business or improving its marketing campaign.
Web Analytics Metrics
Some of the most important web analytics metrics are discussed as follows:
Unique Visitors
It refers to the number of unique users that visit a website within a given time period. Websites use cookies to store information about users. After this, the unique users are again reclassified as new visitors, repeat visitors and return visitors. According to the Web Analytics Association (WAA) Standard, new visitors, repeat visitors and return visitors are defined as follows:
- New Visitor: The visitor who visits a website for the first time in a specified timeframe.
- Repeat Visitor: The number of unique visitors who visit the website for two or more times in a given time period.
- Return Visitor: The number of unique visitors that visit a website in the given time period and who have already visited the website earlier, before the specified time period.
Visits/Sessions
Visits refer to any user interaction with a website within a given time period. Session, on the other hand, refers to a group of user interaction within a given time period.
In general, the session timeout period is 30 minutes. However, this period can be configured as per website requirement. The user interactions may include: page views, events, e-commerce hits, etc.
Pageview
It refers to the number of times a page was loaded. This metric is used by most web analytics tools.
Bounce Rate
Bounce rate refers to the percentage of website visits that are single page visits which do not involve any other interaction or clicks on that page.
Active Time/Engagement Time
Active time or engagement time refers to the average amount of time that a visitor spends in actually interacting with content on Web page. Here, interaction means mouse moves, clicks, and scrolls.
Average Page Depth/Pages Per Sessions
The average page depth is a metric to find the approximate size of an average user visit to website. It is calculated by dividing the total number of page views by total number of visits.
Exit Rate (Percentage of Exit)
The exit rate refers to the percentage of visitors who visited a particular page on a website and then visited one or more other page(s) before leaving the website.
Conversion Rate
Most businesses attach certain goals to website visits. The goals can include downloading content, downloading an app, filling a form or making a purchase. The percentage of visitors that visit a website and complete a desired goal out of the total number of visitors is called conversion rate.
High conversion rates indicate that the marketing and web design efforts of marketers have been successful and users are accepting what is being offered to them.
Screen Views
It is a metric used for mobile anallytics as instead of page views, mobile applications have screen views because apps do not have pages like websites. User on application interact with screens.
Average Session Duration
It is a metric that assesses the average length of sessions on a website starting from landing on the website untill the sessions end. It is calculated by dividing the total duration of all sessions (in seconds) by number of sessions.
SEM Analytics
Search Engine Marketing (SEM) is a type of Internet marketing under which websites are promoted by increasing their visibility in the Search Engine Results Pages (SERPs) using optimisation and advertising.
SEM is done through a combination of Search Engine Optimisation (SEO) and Pay Per Click (PPC). The purpose of SEM is to increase website traffic and achieving high conversion rates which ultimately lead to increase in overall sales.
Both SEM and SEO aim at increasing the digital marketing outreach of a website on search engines like Google and Bing. However, there are differences between these two. While SEO involves organic website optimisation, SEM involves the use of advertising using a paid media budget.
Using SEO, the website traffic increases organically using natural algorithmic means; whereas, SEM increases website traffic by running paid ads on search engines. Whenever you search for anything on a search engine, it generates various results.
You must have noticed that the top few results are specifically indicated as ‘Ad’ below the primary link. It means that a brand or business has paid to Google to display their advertisements on top of page when certain specific keywords are searched by users.
Web Analytics Tools
Choosing a correct set of analytical tools is essential to measure the data efficiency. Different digital analytical tools have different features and different advantages. Let us study about some analytical tools that are used by the majority of marketers to drive valuable insights from data.
Google Analytics
Google Analytics is the most widely-adopted tool that is used to measure the efforts of digital marketing. It offers traffic metrics of websites in a tabular or graphical form. Google Analytics has been tied with PPC, SEO, and social media.
When using Google Analytics, a code has to be inserted into your website that is provided by Google Analytics. When that webpage is opened in the visitors’ browser, the analytics code drops cookies. Dropped cookies are communicated to Google Analytics.
Storage of this data is available in the interface. It is free of cost and used by most brands as it is simple to use even for e-commerce websites. It is highly customisable in the case of specialised campaign needs. This platform offers demographics analytics, location data, user journey, and media used.
Google Analytics tells the following details about your audiences:
- Their location, country, city, and language
- Their browser, service providers, and operating system
- Their age and gender
- Their interest and behaviour
Google Search Console
Google Search Console is a free web-service provided by Google to measure the results of SEO. It analyses the performance of the website on the Google Search Index. It provides features such as search appearance, search traffic, technical status update, and crawl data.
This tool makes you understand how Google crawls and indexes your website. It also delineates the technical issues that hamper the user experience and ranking. It submits and checks the sitemap as sitemaps make the indexing simple. It states the crawl rate, external, and internal linking of the website.
Google Ads
If a business website is not getting good search ranking organically, they may consider using Google Ads (formerly, known as Google Adwords), which is a platform provided by Google, world’s top search-engine platform. Google Ads can help an organisation in reaching specific type of audiences quite quickly and cost-effectively in order to enhance your brand.
Google Ads offers the services of Pay-Per-Click (PPC) advertising. Under the PPC model, the businesses can create advertisements and put up on a website. The businesses pay when users click on the advertisements.
Whenever a user searches anything on the Google search page, the resulting Google Search Engine Results Page (SERP) contains various results where the paid search results usually appear above the organic results. A website can ensure that it gets highest possible ranking if it uses a combination of organic search and paid search using Google Ads.
Google Ads helps in increasing the visibility and enhancing brand awareness as Google has a huge network of daily users. The Google Ads are available in different formats such as text ads, responsive display ads, image ads, app promotional ads, video ads, product shopping ads, and call-only ads.
Google Tag Manager
Google Tag Manager (GTM) is tool provided by Google. Using GTM, a business can manage and deploy tags on a business’s website or mobile app. These tags collect information about the visitors and shares with another data source. At most times, the tags share information for purpose of analytics. GTM is extremely helpful in case there are lots of tags to manage.
The marketers can manage the tags themselves. There are three main parts of a Google Tag Manager: tags, triggers, and variables. Tags are Javascript codes or tracking pixels. Triggers tell GTM when or how to fire a tag. Variables are additional information that the GTM needs for tags and triggers.
Apart from these widely used tools, there are a plethora of other tools available online, such as Yeast SEO, SEMrush, Cyfe, Mixpanel, Moz Pro, HotJar, which help a marketer analyse his digital marketing efforts.
Social Media Analytics refers to the process of collecting, analyzing, and interpreting data from various social media platforms to gain insights into the performance, impact, and effectiveness of social media marketing efforts. It involves tracking and measuring key metrics and indicators to evaluate the success of social media campaigns, understand audience behavior, and make informed decisions for optimizing social media strategies.
Social media platforms are used by marketers for promotions. A huge amount of data can be collected from social media. The business can analyse such data to drive sound business decision making. Based on such data, brands do the segmentation of their target audience on the basis of demographics, such as age, gender, or location.
Social media platforms, such as Facebook, Instagram help in knowing customer sentiments, interest areas, and their likes and dislikes. It analyses brand awareness about what people say and share on social media. A huge amount of information is uncovered from the social media platforms.
There are various metrics used by brands and marketers to measure the performance of social media marketing such as viewability, reach, share and cost per conversion. Many online tools offer social media analytics reports.
These tools help the marketer to identify the organic traffic, social referral sources, and direct traffic drive, and finally, create engagement on the website.
Let us study some useful analytical tools that are available free of cost:
Facebook Insights
This platform is provided by Facebook to analyse the post and engagement received along with the location and demographic breakdown. It also segregates the traffic received organically and through paid ads. Once a Facebook page has more than 30 fans, you can assess the Facebook Insights analytics.
Facebook Insights page shows how many people are following the page and how many followers have joined recently. Also, it states the number of people who unfollowed the page, reviews, page engagements, etc.
It tells you about everything starting from total likes, page views, reach, posts to page previews, etc., on your business page. Insights drawn from such information can help in optimising posts and events on the page.
Pinterest Analytics
This is a built-in analytical platform provided to business account holders. The website needs to be registered with Pinterest. Pinterest Analytics helps businesses track traffic between the social site and your website. It states the average daily impressions, average monthly views and average viewers.
It provides the breakdown of every pin you place on your board by answering how many impressions it got, the number of repins, and how many people liked and how many people clicked on it.
YouTube Analytics
YouTube has an in-built analytics tool that is associated with Google Ads. The dashboard also provides you tabs to get data overview and reports on real-time, estimated earnings, total earnings, playback location, demographics, traffic sources, devices, audience retention, subscribers, likes, dislikes, and favourites. The list of metrics available is exhaustive.
Twitter Analytics
In Twitter, there is an activity dashboard where all the monitoring happens. One can track the number of tweets, profile visits, impressions, followers, and mentions. Such information can help marketers to know whether a user’s number of followers are increasing or decreasing or remaining static and why. Twitter Analytics also tells you whether the demographics of a user’s followers match with the target audience or not. It also states at what time of the day a user’s followers are most active and
Instagram Insights
This platform is offered to business accounts or influencers who receive a lot of engagement. This platform is accessible through the app only.
Although it does not provide in-depth information but it offers different metrics inclusive of overall profile visits and reach. Information about impressions, reach, calls, likes, e-mails, website visits and profile visits are available on Instagram Insights.
Apart from these analytical tools, there are certain other online analytical tools such as Quintly, Brandwatch, Consumer Research, Socialbakers, and Foresight.
Emerging Trends in Digital Analytics
Analytics are used to increase profits and to lower costs by improving the existing strategies and campaigns. Analytical skills need to be updated over time as traditionally, structured data drawn from operational systems are analysed, but, nowadays, unstructured data, such as images, text or rich media drive abundance of data into analytical workflows.
Following are the most popular emerging trends:
Big Data
Big Data consists of large datasets that cannot be managed efficiently by the common database management systems. Through social media, Web mining and transaction, huge data is generated regularly. In a data-driven world, using data in a structured manner is a challenging task for marketers.
All the digital marketing efforts are driven by data. The use of such data has revolutionised the way businesses are earning money. Therefore, analytics should involve use of Big Data in an effective way so as to drive valuable insights.
Predictive Analytics
It is a branch of advanced analytics that is still emerging and is providing a powerful support to digital marketing. It uses big data to predict future events or results. It analyses the pattern of visitors or online buyers to identify potential opportunities and challenges in the near future. The past record has been used in predictive analytics.
Augmented Analytics
The advent of machine learning and Artificial Intelligence (AI) has impacted the way the data has been prepared, collected and shared. It also fosters smart data discovery. People have started adopting voice searches increasingly.
Therefore, it has become quintessential for marketers to analyse voice keywords. With the help of augmented solution, it becomes easy to facilitate a personalised website experience for the site visitors.


